Drawing on a Gantt Chart
Project includes a Drawing toolbar with which you can draw objects directly on the chart portion of a Gantt chart. For example, if you would like to note a particular event or graphically call out a specific item, you can draw objects such as text boxes, arrows, and other items directly on a Gantt chart. If you want, you can link a drawn object to either end of a Gantt bar or to a specific date on the timescale. Here’s how to choose the kind of link you need:
-
Link objects to a Gantt bar when the object is specific to the task the Gantt bar represents. The object will move with the Gantt bar, if it is rescheduled.
-
Link objects to a date when the information the object refers to is date-sensitive. The object will remain in the same position relative to the timescale, no matter which part of the timescale is displayed.
| Tip | If the Drawing toolbar does not have the type of item you would like to add, you can add bitmap images or documents using the Object command on the Insert menu. |
In this exercise, you display the Drawing toolbar and add a text box to the Custom Gantt Chart view.
-
On the View menu, point to Toolbars, and then click Drawing.
The Drawing toolbar appears.
Tip You can also right-click any toolbar to see the Toolbars shortcut menu, and then display or hide a toolbar listed on that menu.
-
On the Drawing toolbar, click the Text Box button, and then drag a small square anywhere on the chart portion of the Custom Gantt Chart view.
-
In the square you just drew, type Film festival January 13 and 14.
-
On the Format menu, point to Drawing, and then click Properties.
The Format Drawing dialog box appears.
Tip You can also double-click the border of the text box to view its properties.
-
Click the Line & Fill tab if it is not already selected.
-
In the Color box under the Fill label, click Yellow.
Next, you’ll attach the text box to a specific date on the timescale.
-
Click the Size & Position tab.
-
Make sure that Attach To Timescale is selected, and in the Date box, type or click 1/13/05.
-
In the Vertical box under Attach To Timescale, type 2.75, (this is the number of inches below the timescale where the top of the box will be positioned) and then click OK to close the Format Drawing dialog box.
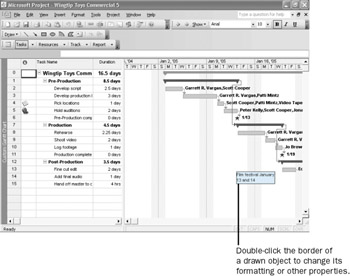
Project colors the text box yellow and positions it below the timescale near the date you specified. Your screen should look similar to the following illustration:
-
Because you attached the text box to a specific date on the timescale, it will always appear near this date, even if you zoom the timescale in or out, or scroll the chart left or right. Had you attached the text box to a Gantt bar, it would move with the Gantt bar if the task were rescheduled. To conclude this exercise, you will hide the Drawing toolbar.
-
On the View menu point to Toolbars, and then click Drawing.
The Drawing toolbar is hidden.
EAN: 2147483647
Pages: 199