Creating a Custom Gantt Chart View
The Gantt chart became a standard way of visualizing project plans when, in the early twentieth century, American engineer Henry Gantt developed a bar chart showing the use of resources over time. For many people, a Gantt chart is synonymous with a project plan. In Project, the default view is the Gantt Chart view. You are likely to spend a lot of your time in this view when working in Project.
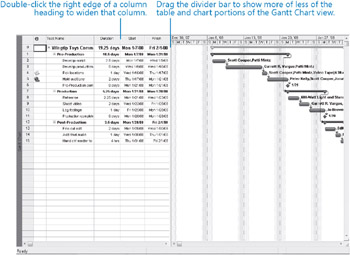
The Gantt Chart view consists of two parts: a table on the left and a bar chart on the right. The bar chart includes a timescale band across the top that denotes units of time. The bars on the chart graphically represent the tasks in the table in terms of start and finish dates, duration, and status (for example, whether work on the task has started or not). Other elements on the chart, such as link lines, relationships represent between tasks. The Gantt chart is a popular and widely understood representation of project information throughout the project management world.
| Tip | By default, Project displays the Gantt Chart view when you start the program. However, you can change this setting to display any view you want at startup. On the Tools menu, click Options. In the Options dialog box, click the View tab. In the Default View box, click the view you want. The next time you start Project and create a new project plan, the view you have chosen will appear. |
The default formatting applied to the Gantt Chart view works well for onscreen viewing, sharing with other programs, and printing. However, you can change the formatting of almost any element on the Gantt chart. In this exercise, we will focus on Gantt bars.
There are three distinct ways to format Gantt bars:
-
Format whole categories of Gantt bars in the Bar Styles dialog box, which you can open by clicking the Bar Styles command on the Format menu. In this case, the formatting changes you make to a particular type of Gantt bar (a summary task, for example) apply to all such Gantt bars in the Gantt chart.
-
Format whole categories of Gantt bars using the Gantt Chart Wizard, which you can start by clicking the Gantt Chart Wizard command on the Format menu. This wizard contains a series of pages in which you select formatting options for the most commonly used Gantt bars on the Gantt chart. Use the Gantt Chart Wizard to step you through some of the formatting actions that you can perform in the Bar Styles dialog box.
-
Format individual Gantt bars directly. The formatting changes you make have no effect on other bars in the Gantt chart. You can double-click a Gantt bar on the Gantt chart to view its formatting options, or click Bar on the Format menu.
In this exercise, you create a custom Gantt chart and apply predefined formatting to it using the Gantt Chart Wizard. You then preview the results for printing.
Be Sure To start Microsoft Office Project 2007 if it’s not already running.
| Important | If you are running Project Professional, you may need to make a one-time adjustment to use the Computer account and to work offline. This ensures that the practice files you work with in this chapter do not affect your Project Server data. For more information, see “Starting Project Professional” on page 11. |
Open Wingtip Toys Commercial 5a from the \Documents\Microsoft Press\Project 2007 SBS\Chapter 5 Simple Formatting folder. You can also access the practice files for this book by clicking Start All Programs, Microsoft Press, Project 2007 Step by Step, and then selecting the chapter folder of the file you want to open.
1. On the File menu, click Save As.
The Save As dialog box appears.
2. In the File name box, type Wingtip Toys Commercial 5, and then click Save.
Next, you will display the project summary task to see the top-level or rolled-up details of the project. Project automatically generates the project summary task but doesn’t display it by default.
3. On the Tools menu, click Options.
4. In the Options dialog box, click the View tab.
5. Under the Outline options for label, select the Show project summary task check box, and then click OK.
Project displays the project summary task at the top of the Gantt Chart view. You might see pound signs (##) or only part of the value in the project summary task’s Duration field. If so, complete step 6.
6. Double-click the right edge of the Duration column in the column heading to expand the column so that you can see the entire value.
| Tip | You can also double-click anywhere in a column heading and, in the Column Definition dialog box that appears, click the Best Fit button. To quickly move the vertical divider bar to the edge of the nearest column in the table, double-click the divider bar. |
The Duration column widens to show the widest value in the column.
Next, you will create a copy of the Gantt Chart view so that the formatting changes you make will not affect the original Gantt Chart view.
7. On the View menu, click More Views.
The More Views dialog box appears, with the current view (the Gantt Chart view) selected.
8. Click the Copy button.
The View Definition dialog box appears.
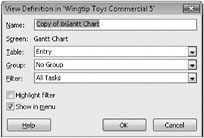
The Name field contains the proposed name of the new view as it will appear in the More Views dialog box and, if you specify, on the View menu. Note the ampersand (&) in the Name field. This is a code that indicates the keyboard shortcut character of the new view name, should you wish to include one.
9. In the Name field, type Custom Gantt Chart, and then click OK.
The View Definition dialog box closes. The Custom Gantt Chart view appears and is selected in the More Views dialog box.
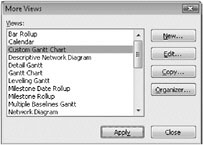
10. In the More Views dialog box, click the Apply button.
11. On the Standard toolbar, click Scroll to Task.
At this point, the Custom Gantt Chart view is an exact copy of the original Gantt Chart view, so the two views look alike. Note, however, that the view title on the left edge of the view is updated.
Next, you will use the Gantt Chart Wizard to format the Gantt bars and milestones in the chart portion of the Custom Gantt Chart view.
12. On the Format menu, click Gantt Chart Wizard.
The welcome page of the Gantt Chart Wizard appears.
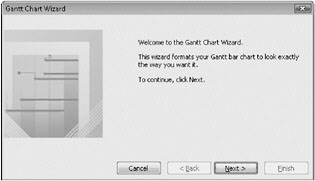
13. Click Next.
The next screen of the Gantt Chart Wizard appears.
14. Click Other, and on the drop-down list next to the Other option, click Standard: Style 4.
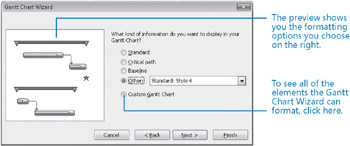
| Tip | If you want to view the other built-in Gantt chart formats available in the wizard, click them in the Other box to see the preview on the left side of the wizard’s window. When you are done, make sure that Standard: Style 4 is selected. |
15. This is the only selection you’ll make in the Gantt Chart Wizard for now, so click the Finish button.
The final page of the Gantt Chart Wizard appears.
16. Click the Format It button, and then click the Exit Wizard button.
The Gantt Chart Wizard applies the Standard: Style 4 formatting to the Custom Gantt Chart view and then closes.
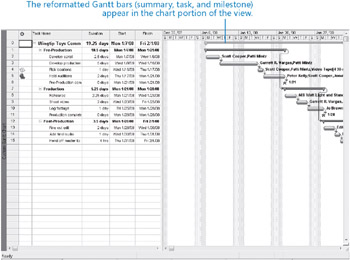
Here you can see the effects of the Standard: Style 4 formatting applied to the project plan. Note that none of the data in the project plan has changed; only the way it is formatted has changed. These formatting changes affect only the Custom Gantt Chart view; all other views in Project are unaffected.
Next, you will format an individual Gantt bar. You’d like to give more visual attention to the Gantt bar for the Hold auditions task.
17. Click the name of task 5, Hold auditions.
18. On the Format menu, click Bar.
19. On the Bar Shape tab, under Middle, click the Color box.
20. Click Blue, and then click OK.
Project applies the blue color to the Task 5 Gantt bar.
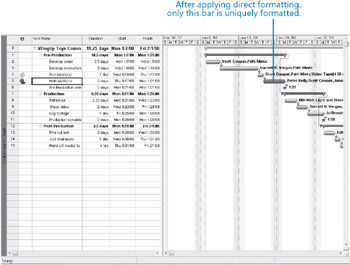
To conclude this exercise, you will preview the Custom Gantt Chart view. What you see on the screen closely approximates what you’d see on the printed page, and you’ll verify this now.
21. On the File menu, click Print Preview.
Project displays the Custom Gantt Chart view in the Print Preview window. You will do more work in the Print Preview window later in this chapter and in Chapter 11.
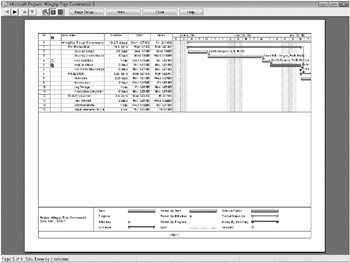
| Important | If you have a plotter (a device used to draw charts, diagrams, and other line-based graphics) selected as your default printer or you have a different page size selected for your default printer, what you see in the Print Preview window might differ from what you see here. |
22. On the Print Preview toolbar, click Close.
You can now print the project plan if desired, but previewing it is adequate for the purposes of this chapter. When printing in Project, you have additional options in the Print dialog box, which you can open by clicking the Print command on the File menu. For example, you can choose to print a specific date range of a timescaled view, such as the Gantt Chart view, or you can print a specific page range.
EAN: 2147483647
Pages: 247