Printing Reports
Reports are predefined formats intended for printing Project data. Unlike views, which you can either print or work with onscreen, reports are designed only for printing. You don’t enter data directly into a report. Project includes several predefined reports that you can edit to display the information you want.
Although reports are distinct from views, some settings that you specify for a view might affect certain reports. For example:
-
If subtasks are collapsed or hidden under summary tasks in a view, reports that include task lists will show only the summary tasks and not the subtasks.
-
In usage views, if assignments are collapsed or hidden under tasks or resources, the usage reports (Task Usage or Resource Usage) likewise hide assignment details.
| Tip | New in Project 2007 is a powerful new feature called visual reports. Visual reports can play an important role in your schedule reporting and analysis needs. Because visual reports depend on exporting Project data to other Office applications, we describe them in Chapter 12, “Sharing Project Information with Other Programs.” |
In this exercise, you see a report in the Print Preview window, and then you edit its definition (that is, the set of elements that make up the report) to include additional information.
1. On the Report menu, click Reports.
The Reports dialog box appears, displaying the broad categories of reports available in Project.
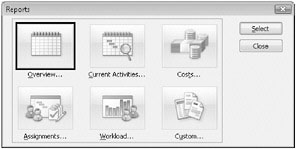
2. Click Custom, and then click Select.
The Custom Reports dialog box appears.
| Tip | You can also double-click the Custom category. |
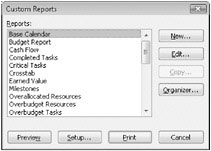
This dialog box lists all predefined reports in Project as well as any custom reports that have been added.
3. In the Reports box, click Task, and then click the Preview button.
Project displays the Task report in the Print Preview window.
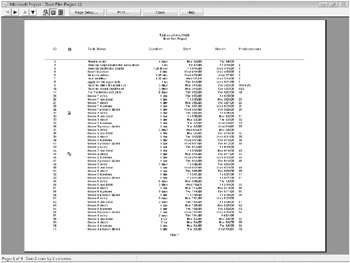
This report is a complete list of project tasks (except for summary tasks), similar to what you’d see in the Entry table of the Gantt Chart view. You’d like to see this data presented in a different way, so you’ll edit this report.
4. On the Print Preview toolbar, click Close.
The Print Preview window closes, and the Custom Reports dialog box reappears. Next, you’ll create a copy of a built-in report and modify the copy.
5. In the Reports box, make sure that Task is still selected, and then click the Copy button.
The Task Report dialog box appears.
| Tip | The Task Report dialog box, like many dialog boxes in Project, includes a Help button that you can click for detailed descriptions of the settings in the dialog box. |
6. In the Name box, select the displayed text, and then type Custom Task Report.
7. In the Period box, click Months on the drop-down list.
Choosing Months here groups tasks by the month in which they occur. Because the report now includes a time period element, the Timescale options in the Print dialog box become available, enabling you to print data within a specific date range if you want.
8. In the Table box, click Summary on the drop-down list.
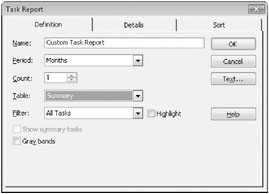
| Tip | The tables listed in the Task Report dialog box are the same as those you can apply to any view that displays tasks in a table. In fact, if you completed Chapter 10, “Organizing and Formatting Project Details,” the Shooting Schedule table you created there appears in the list here. When editing a report format, you can apply predefined or custom tables and filters, choose additional details to include in the report, and apply a sort order to the information-all in the dialog box for the report you’re editing. |
9. Click OK to close the Task Report dialog box.
10. In the Custom Reports dialog box, make sure that Custom Task Report is selected in the Reports box, and then click Preview.
Project applies the custom report settings you chose to the report, and the report appears in the Print Preview window. Next, you will zoom in to see the report in more detail.
11. In the Print Preview window, click the upper left corner of the page with the magnifying-glass pointer.
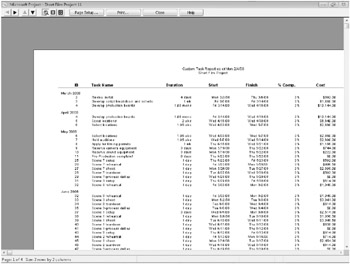
This custom report shows the fields displayed in the Summary Task table, but divides the tasks by month.
12. On the Print Preview toolbar, click Close.
13. In the Custom Reports dialog box, click Close.
14. Click Close again to close the Reports dialog box.
The Gantt Chart view reappears.
Close the Short Film Project 11 file.
EAN: 2147483647
Pages: 247