New Diagnostics Tools
| Fixing computer problems is only as effective and as reliable as your diagnosis of the problem in the first place. Without an accurate diagnosis, you can't hope to effect a proper repair or recovery. It's also true that a diagnosis need not only be an after-the-unpleasant-fact task. Instead of waiting to deal with computer difficulties after they've occurred (what I call pound-of-cure mode), it would be great if users' diagnostics could tell them about potential problems in advance (call it Ounce of Prevention mode). Windows Vista comes with new diagnostic toolstogether, they're called the Windows Diagnostic Infrastructure (WDI)that not only do a better job of finding the source of many common disk, memory, and network problems, but that can also detect impending failures and alert you to take corrective or mitigating action (such as backing up your files). Disk DiagnosticsA hard disk can suddenly bite the dust thanks to a lightning strike, an accidental drop from a decent height, or an electronic component shorting out. However, most of the time hard disks die a slow death. Along the way, hard disks almost always show some signs of decay, such as the following:
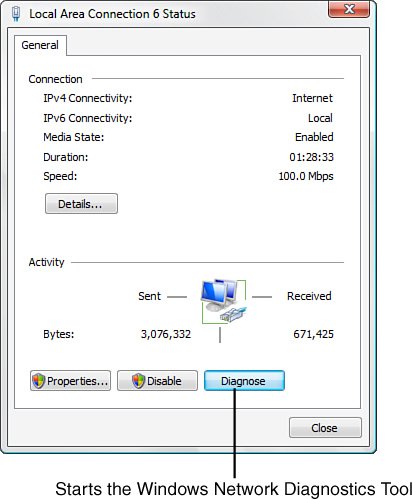
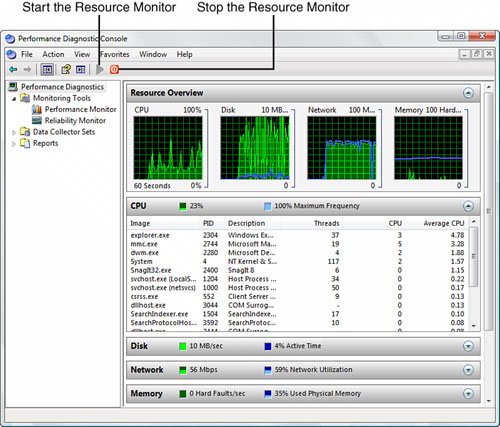
Other factors that might indicate a potential failure are the number of times that the hard drive has been powered up, the number of hours in use, and the number of times the drive has started and stopped spinning. Since about 1996, almost all hard-disk manufacturers have built into their drives a system called Self-Monitoring, Analysis, and Reporting Technology, or SMART. This system monitors the parameters just listed (and usually quite a few more highly technical hard disk attributes) and uses a sophisticated algorithm to combine these attributes into a value that represents the overall health of the disk. When that value goes beyond some predetermined threshold, SMART issues an alert that hard-disk failure may be imminent. Although SMART has been around for a while and is now standard, taking advantage of SMART diagnostics has, until now, required third-party programs. However, Windows Vista comes with a new Diagnostic Policy Service (DPS) that includes a Disk Diagnostics tool that can monitor SMART. If the SMART system reports an error, Vista displays a message that your hard disk is at risk. It also guides you through a backup session to ensure that you don't lose any data before you can have the disk replaced. Memory DiagnosticsFew computer problems are as maddening as those related to physical memory defects because they tend to be intermittent and they tend to cause problems in secondary systems, forcing you to waste time on wild goose chases all over your system. So it is welcome news indeed that Vista ships with a new Windows Memory Diagnostics tool that works with Microsoft Online Crash Analysis to determine whether defective physical memory is the cause of program crashes. If so, Windows Memory Diagnostics lets you know about the problem and schedules a memory test for the next time you start your computer. If actual problems are detected, the system also marks the affected memory area as unusable to avoid future crashes. Windows Vista also comes with a Memory Leak Diagnosis tool that's part of the Diagnostic Policy Service. If a program is leaking memory (using up increasing amounts of memory over time), this tool will diagnose the problem and take steps to fix it. Resource Exhaustion DetectionYour system can become unstable if it runs low on virtual memory, and there's a pretty good chance it will hang if it runs out of virtual memory. Older versions of Windows displayed one warning when they detected low virtual memory and another warning when the system ran out of virtual memory. However, in both cases, users were simply told to shut down some or all of their running programs. That often solved the problem, but shutting everything down is usually overkill because it's often the case that just one running program or process is causing the virtual memory shortage. Vista takes this more subtle point of view into account with its new Windows Resource Exhaustion Detection and Resolution tool (RADAR), which is part of the Diagnostic Policy Service. This tool also monitors virtual memory and issues a warning when resources run low. However, RADAR also identifies which programs or processes are using the most virtual memory, and it includes a list of these resource hogs as part of the warning. This enables you to shut down just one or more of these offending processes to get your system in a more stable state. Microsoft is also providing developers with programmatic access to the RADAR tool, thus enabling vendors to build resource exhaustion detection into their applications. When such a program detects that it is using excessive resources, or if it detects that the system as a whole is low on virtual memory, the program can free resources to improve overall system stability. Note The Resource Exhaustion Detection and Recovery tool divides the current amount of committed virtual memory by the commit limit, the maximum size of the virtual memory paging file. If this percentage approaches 100, RADAR issues its warning. If you want to track this yourself, run System Monitor (see "Performance Monitor," later in this chapter) and add the % Committed Bytes In Use counter in the Memory object. If you want to see the exact commit numbers, add the Committed Bytes and Commit Limit counters (also in the Memory object). Network DiagnosticsResolving networking connectivity issues has never been an easy task for people who aren't networking professionals. Solutions often entail such arcane actions as "renewing the DHCP lease" and "flushing the ARP cache." Even if you are a networking pro, solving a user's network connectivity and access issues can't be done remotely (by definition) and so requires a visit to the user's desk. Windows Vista aims to make diagnosing and solving network problems easier with a new Windows Network Diagnostics Tool. This feature analyzes all aspects of the network connection and then either fixes the problem or provides the user with simple instructions for resolving the situation. You can access the Windows Network Diagnostic Tool easily by viewing the connection status from the Network Center, and then clicking the Diagnose button, as shown in Figure 5.9. (See Chapter 8, "New Networking Features," to learn more about the Network Center.) Figure 5.9. Click Diagnose in the connection status dialog box to launch the Windows Network Diagnostics Tool. Windows Performance Diagnostic ConsoleBesides the automatic diagnostic tools mentioned in the previous few sections, Windows Vista comes with a new tool for monitoring your system yourself: the Windows Performance Diagnostic Console. You load this Microsoft Management Console snap-in by pressing Windows Logo+R, typing perfmon.msc, and clicking OK. Figure 5.10 shows the console window that appears. Figure 5.10. The new Diagnostic Console enables you to monitor various aspects of your system.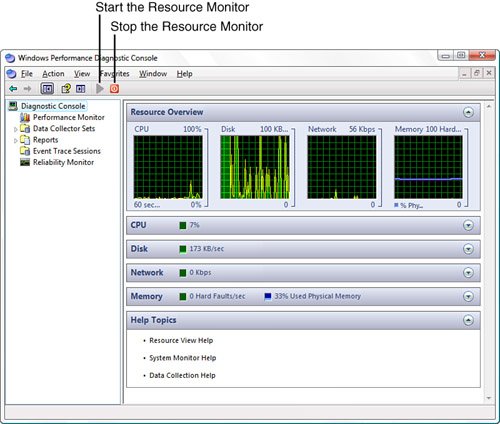 The console rootPerformance Diagnosticsdisplays the Resource Monitor, which is divided into six sections:
Note A memory fault does not refer to a physical problem. Instead, it means that the system could not find the data it needed in the file system cache. If it then finds the data elsewhere in memory, this is called a soft fault; if the system has to go to the hard disk to retrieve the data, this is called a hard fault.
The Performance Diagnostic Console tree has three branches: Monitoring Toolswhich includes the Performance Monitor and the Reliability Monitor (which I discussed earlier in this chapter; see "Reliability Monitor")Data Collector Sets, and Reports. Performance MonitorThe Performance Monitor branch displays the Performance Monitor, which provides you with real-time reports on how various system settings and components are performing (see Figure 5.12). Each item is called a counter, and the displayed counters are listed at the bottom of the window. Each counter is assigned a different-colored line, and that color corresponds to the colored lines shown in the graph. Note, too, that you can get specific numbers for a counterthe most recent value, the average, the minimum, and the maximumby clicking a counter and reading the boxes just below the graphs. The idea is that you should configure Performance Monitor to show the processes you're interested in (page file size, free memory, and so on) and then keep Performance Monitor running while you perform your normal chores. By examining the Performance Monitor readouts from time to time, you gain an appreciation of what is typical on your system. Then if you run into performance problems, you can check Performance Monitor to see whether you've run into any bottlenecks or anomalies. Figure 5.12. Use Performance Monitor to keep an eye on various system settings and components.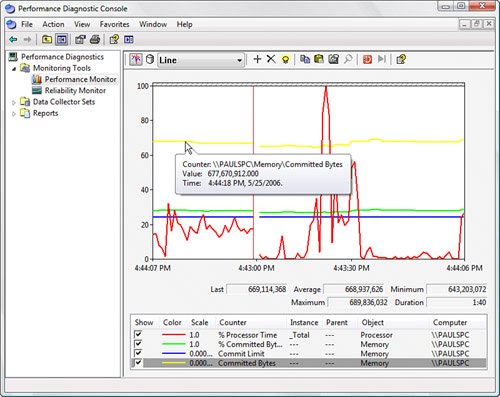 Performance Monitor was called System Monitor in previous versions of Windows, and it has been around for a while. However, Vista's version has a few new features that make it easier to use and a more powerful diagnostics tool:
Data Collector SetsA data collector is a custom set of performance counters, event traces, and system-configuration data that you define and save so that you can run and view the results any time you need them. You can also configure a data collector set to run for a preset length of time or until the set reaches a specified size. You can configure a data collector to run on a schedule as well. For example, you could run the data collector every hour for 15 minutes from 9 a.m. to 5 p.m. This enables you to benchmark performance and analyze the results not only intraday (say, to compare performance at different times of the day), but also interday (say, to see if performance is slowing over time). ReportsThis section holds the reports created by each data collector set. These are .blg files, and you can see the results by clicking the report and then switching to Sysmon view (click the Chart icon in the toolbar), as shown in Figure 5.13. Alternatively, open the folder that contains the report file in Windows Explorer (the default save location is %SystemDrive%\perflogs) and double-click the report file. Figure 5.13. A data collector set report displayed in Sysmon view.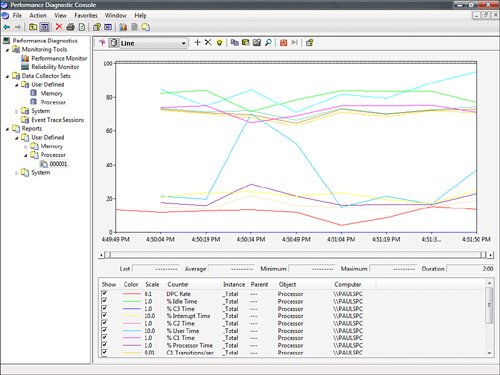 Event Trace SessionsThe Event Trace Sessions branch (part of the Data Collector Sets branch), shown in Figure 5.14, lists the defined sessions for tracing events of various types. In particular, note the sessions named EventLog-Application, EventLog-SECURITY, and EventLog-System. These sessions generate the Application, Security, and System event logs that you see in the Event Viewer (discussed in the next section). Figure 5.14. The Event Trace Sessions branch shows the defined sessions that Vista uses for tracing system events.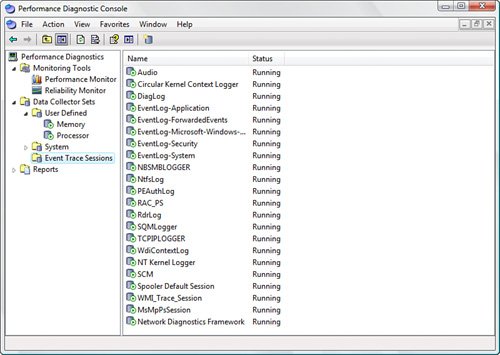 Event ViewerWindows Vista constantly monitors your system for unusual or noteworthy occurrences. It might be a service that doesn't start, the installation of a device, or an application error. Vista tracks these occurrences, called events, in several different event logs. For example, the Application log stores events related to applications, including Windows XP programs and third-party applications. The System log stores events generated by Windows XP and components such as system services and device drivers. You should scroll through the Application and System event logs regularly to look for existing problems or for warnings that could portend future problems. To examine these logs, you use the Event Viewer snap-in, which has a much-improved interface in Windows Vista. You get to the Event Viewer by using any of the following techniques:
Figure 5.15 shows the home page of the Event Viewer, which offers a summary of events, recent views, and available actions. (If you don't see the Action pane, click the Show/Hide Action Pane toolbar button, pointed out in Figure 5.15.) Figure 5.15. The Event Viewer is much improved in Windows Vista, with a new interface and new features.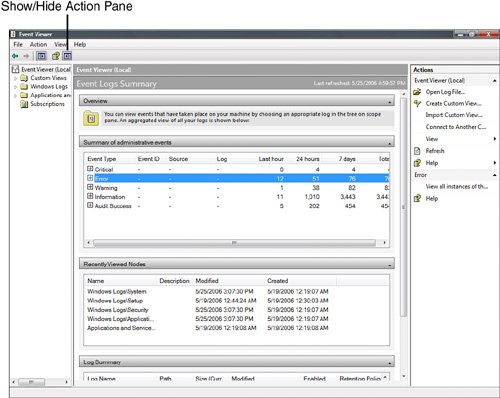 The scope pane offers three branches: Custom Views, Windows Logs, and Applications and Services Logs. The Custom Views branch lists the event views that have been defined on your system (as described below). If you filter an event log or create a new event view, the new view is stored in the Custom Views branch. The Windows Logs branch displays several sub-branches, four of which represent the main logs that the system tracks (see Figure 5.16):
Figure 5.16. Click a log to see a list of the events in that log.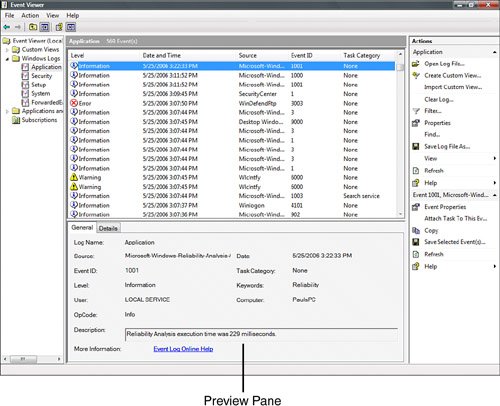 When you select a log, the middle pane displays the available events, including the event's date, time, and source; its type (Information, Warning, or Error); and other data. Here's a summary of the major interface changes and new features that you get when viewing a log in Vista's Event Viewer:
The Applications and Services Logs branch lists the programs, components, and services that support the standard event-logging format that is new to Windows Vista. All of the items in this branch formerly stored their logs in separate text files that were unavailable in older versions of Event Viewer unless you specifically opened the log file. System Configuration Utility EnhancementsIf you're having trouble during Windows startup, or if you want to try a few different startup configurations to see whether you can eliminate startup items or improve the overall performance of Windows, don't bother trying out different startup configurations by hand. Instead, take advantage of the improved System Configuration Utility, which gives you a graphical front end that offers precise control over how Windows starts. You launch the System Configuration Utility by pressing Windows Logo+R, typing msconfig, and clicking OK. Here's a summary of the differences you see in the Vista version of the System Configuration Utility versus the XP version:
|

EAN: 2147483647
Pages: 122