Monitoring Performance
Performance optimization is a bit of a black art in that every user has different needs, every configuration has different operating parameters, and every system can react in a unique and unpredictable way to performance tweaks. What this means is that if you want to optimize your system, you have to get to know how it works, what it needs, and how it reacts to changes. You can do this by just using the system and paying attention to how things look and feel, but a more rigorous approach often is called for. To that end, the next few sections take you on a brief tour of Microsoft Windows XP’s performance monitoring capabilities.
Using Task Manager
The Task Manager utility is excellent for getting a quick overview of the current state of the system. To display it, press Ctrl+Alt+Delete. (If you are using the Classic logon screen, the Windows Security dialog box will appear; click the Task Manager button.)
| Tip | To bypass the Windows Security dialog box, right-click an empty section of the taskbar and then select Task Manager. |
The Processes tab, shown in Figure 11-1, displays a list of the programs, services, and system components that are currently running on your computer. The processes are displayed in the order in which they were started, but you can change the order by clicking the column headings. (Note that to get back to the original, chronological display of processes, you will need to close and reopen Task Manager.) Besides the name of each process and the user who started the process, you also see two performance measures:
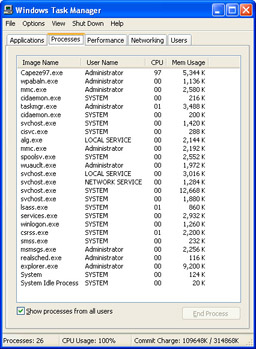
Figure 11-1: : The Processes tab lists your system’s running programs and services.
-
CPU This value tells you the percentage of CPU resources that the process is using. If your system seems sluggish, look for a process that is consuming all or nearly all of the CPU’s resources. Most programs will occasionally monopolize the CPU for short periods, but a program that is stuck at 100 (percent) for a long time most likely has some kind of problem. In this case, try shutting down the program. If that doesn’t work, click the program’s process and then click End Process. Click Yes when Windows XP asks if you’re sure you want to do this.
-
Mem Usage This value tells you approximately how much memory the process is using. This value is less informative, since a process may genuinely require a lot of memory in order to function. However, if this value is increasing steadily for a process that you’re not using, a problem may be present, and you should shut down the process.
The four default columns on the Processes tab aren’t the only data available to you. Select the View, Select Columns command to see a list of more than two dozen items that you can add to the Processes tab.
The Performance tab, shown in Figure 11-2, offers a more substantial collection of performance data, particularly for that all-important component: your system’s memory.
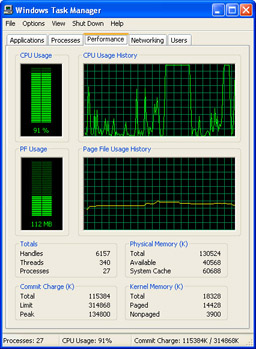
Figure 11-2: The Performance tab lists various numbers related to your system’s memory and CPU components.
The graphs show you both the current value and the values over time for CPU usage and page file usage.
What is a page file? Your computer can address memory beyond what is physically installed on the system. This non-physical memory is called virtual memory, and it’s implemented by using a piece of your hard disk that’s set up to emulate physical memory. This hard disk storage is actually a single file called a page file (or sometimes a paging file or a swap file). When physical memory is full, Windows XP makes room for new data—either program code or document contents—by taking some infrequently used data that’s currently in memory and swapping it out to the page file. The PF Usage graph shows the current utilization of the page file, and the Page File Usage History graph shows the relative size of the page file over time.
Below the graphs are various numbers. The items in the Totals section of the window appeal only to programmers, so we’ll skip them. Here’s what the other values mean:
| Note | The memory values are listed in kilobytes. To convert to megabytes, divide by 1,024. |
-
Physical Memory Total The total amount of physical random access memory (RAM) in your system.
-
Physical Memory Available The amount of physical RAM that Windows XP has available for your programs. Note that the system cache (see the next item) is not included in this total.
-
Physical Memory System Cache The amount of physical RAM that Windows XP has set aside to store recently used programs and documents.
-
Commit Charge Total The combined total of physical RAM and virtual memory the system is using.
-
Commit Charge Limit The combined total of physical RAM and virtual memory available to the system.
-
Commit Charge Peak The maximum combined total of physical RAM and virtual memory the system has used so far in this session.
-
Kernel Memory Total The total amount of RAM used by the Windows XP system components and device drivers.
-
Kernel Memory Paged The amount of kernel memory that is mapped to pages in virtual memory.
-
Kernel Memory Nonpaged The amount of kernel memory that cannot be mapped to pages in virtual memory.
Here are some notes related to these values that will help you monitor memory-related performance issues:
-
If the Physical Memory Available value approaches zero, it means your system is starved for memory. You may have too many programs running, or a large program may be using lots of memory.
-
If the Physical Memory System Cache value is much less than half the Physical Memory Total, it means your system isn’t operating as efficiently as it could because Windows XP can’t store enough recently used data in memory. Because Windows XP gives up some of the system cache when it needs RAM, close down programs you don’t need.
-
If the Commit Charge Total value remains higher than the Physical Memory Total value, it means Windows XP is doing a lot of work swapping data to and from the page file, which greatly slows performance.
-
If the Commit Charge Peak is higher than the Physical Memory Total value, it means at some point in the current session Windows XP had to use the page file. If the Commit Charge Total is currently less than Physical Memory Total, the peak value may have been a temporary event, but you should monitor the peak over time, just to make sure.
In all of these situations, the quickest solution is to reduce the system’s memory footprint either by closing documents or by closing applications. For the latter, use the Processes tab to determine which applications are using the most memory and then shut down the ones you can live without for now. The better, but more expensive, solution is to add more physical RAM to your system. This decreases the likelihood that Windows XP will need to use the paging file, and it also enables Windows XP to increase the size of the system cache, which greatly improves performance.
Using System Monitor
For more advanced performance monitoring, Windows XP offers the System Monitor tool, which you can get to by selecting Start, Run, entering perfmon.msc, and clicking OK. System Monitor appears in the Performance window, as shown in Figure 11-3.
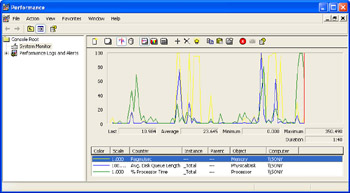
Figure 11-3: Use System Monitor to keep an eye on various system settings and components.
System Monitor’s job is to provide you with real-time reports on how various system settings and components are performing. Each item is called a counter, and the displayed counters are listed at the bottom of the window. Each counter is assigned a different colored line, and that color corresponds to the colored lines shown in the graph. Note, too, that you can get specific numbers for a counter—the most recent value, the average, the minimum, and the maximum—by clicking a counter and reading the boxes just below the graphs.
The idea is that you should configure System Monitor to show the processes you’re interested in (page file size, free memory, and so on) and then keep System Monitor running while you perform your normal chores. By examining the System Monitor readouts from time to time, you gain an appreciation of what is “typical” on your system. Then, if you run into performance problems, you can check System Monitor to see whether you’ve run into any bottlenecks or anomalies.
By default, System Monitor shows only the Kernel Processor Usage setting, which tells you the percentage of time the processor is busy. To add another setting to the System Monitor window, follow these steps:
-
Right-click a counter and then select Add Counters. The Add Counters dialog box appears.
-
Use the Performance Object list to select a counter category (such as Memory, Paging File, or Processor).
-
Choose the Select Counters From List option.
-
Select the counter you want and then click Add. (If you need more information about the item, click the Explain button.)
-
Repeat step 4 to add any other counters you want to monitor.
-
Click Close.
EAN: 2147483647
Pages: 126