Client-Side Logging
| Client-side logging rarely uses techniques such as Windows event logging, e-mailing, or Message Queuing. The reasons are simple: the client, after it has been deployed, is difficult to update or reconfigure. And furthermore, the client machine isn't guaranteed to provide the necessary ingredients (such as a properly configured Message Queuing service or an SMTP server for mail delivery). Even if it did, there would be no way report network or connection problems if they interfere with these services. Another, more fundamental, distinction between client and server errors is the fact that server errors represent shortcomings in your code. Client-side errors can also fall prey to coding errors, but they are more likely to result from misconfiguration or connectivity problems. The last thing you want is to clutter your log with hundreds of trivial client events that might be successfully resolved without your intervention. Generally, client logging takes one of two forms (as described in Table 14-4). If you want to be informed of a particularly significant error that doesn't relate to connectivity issues, you might add an XML Web service that the client can call when the error occurs. The Web method can then log the information, send an e-mail message, or perform whatever additional processing is needed. Of course, this raises the possibility that a user might discover this method and call it for malicious reasons (if it isn't safeguarded with the appropriate authentication code).
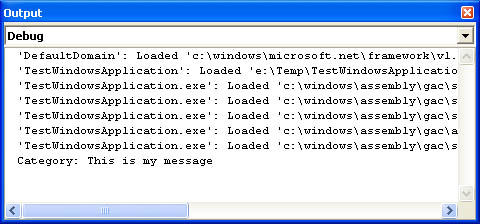
A more common approach is to use the logging features built into .NET. These logging features can be easily enabled, disabled, and further configured through switches. Therefore, in its standard configuration, .NET might ignore the logging code. If a mysterious error develops at the client site, however, the client can instruct the program to log all its actions by changing a simple configuration file setting and e-mail the resulting file to the technical support department. To implement this approach, you must understand .NET tracing and trace switches. Using Tracing.NET provides a Trace class in the System.Diagnostics namespace. The Trace class is quite similar to the Debug class, which you might have used to write messages to the Output window in Visual Studio .NET while testing an application. The key difference is that the Debug class is intended for writing messages that are useful purely in a testing environment. These messages are therefore disabled in the release version of an assembly. Tracing, however, is used to record information that might be useful in the field for instrumentation or diagnostic purposes. For that reason, tracing is enabled by default in the release version of an assembly. Note Technically, tracing is enabled in the release version when you compile with Visual Studio .NET. This is because Visual Studio .NET automatically adds the /d:Trace=True switch to the compiler command line. If you're compiling the code manually, you need to add this switch. (Similarly, you can disable it in a Visual Studio .NET project by finding the appropriate section in the project's Properties window and removing the trace switch.) The Trace class provides two important shared methods: Write and WriteLine. (WriteLine is the same as Write, but it adds a trailing line break.) The first parameter to the Write or WriteLine method can be a string containing a message or it can be an object. If it is an object, .NET just calls the object's ToString method to arrive at the appropriate trace message. Optionally, you can add a second parameter, which is a category name. The category name is just added to the beginning of the message, followed by a colon (:). It isn't used to determine sorting. Consider the following code statement: Trace.WriteLine("This is my message", "Category") It produces this output with the default trace listener: Category: This is my message If you add this code to a new .NET application, the message appears in the Debug view of the Output window (as shown in Figure 14-7). Figure 14-7. Viewing trace information in the Output window At run time, you won't see anything. However, tracing is still enabled. If you attach the Visual Studio .NET debugger to your application, any subsequent messages appear in the Output window. This technique was demonstrated in Chapter 7 with Windows service debugging. You also can use trace assertions, which check a condition and only display a message if the result is False. Essentially, with a trace assertion you're claiming that a given condition should always hold true. If it doesn't, you want to log this failure. Trace.Assert(Balance >= 0, "Somehow the balance became negative.") Trace assertions don't take the place of the validation code you need to verify user input. Instead, trace assertions are meant to test assumptions in your code that will always hold true unless there is a coding error. Trace ListenersMost clients won't be able to attach a debugger just to view a trace message. Fortunately, the Trace class can send output to any valid class derived from System.Diagnostics.TraceListener. In .NET, there are only three such classes (although it's trivially easy to develop your own): DefaultTraceListener, TextWriterTraceListener, and EventLogTraceListener. The Trace class provides a collection of registered listeners through the Trace.Listeners property. An instance of the DefaultTraceListener class is added automatically, which is why you can see the trace messages appear in the Output window at design time. If you add an instance of the EventLogTraceListener, the trace messages are automatically echoed to an event log, where they are stored permanently: ' Define a listener that represents a custom Windows event log. Dim Listener As New EventLogTraceListener("CustomLog") ' Register the listener so it will receive trace messages. Trace.Listeners.Add(Listener) Alternatively, you can use the TextWriterTraceListener to send trace output to a TextWriter or Stream. .NET abounds with examples of Stream-derived classes, but one of the most relevant for tracing is the FileStream. With a FileStream and a TextWriterTraceListener, you can capture messages in a local file: ' Create the log file. Dim LogFile As FileStream = File.Create("c:\mylogfile.txt") ' Create a new text writer using the output stream, ' and add it to the trace listeners. Dim FileListener As New TextWriterTraceListener(LogFile) Trace.Listeners.Add(FileListener) ' Ensure that messages are written to the file immediately. Trace.AutoFlush = True The last line ensures that messages are written to the file immediately. Otherwise, if you exit the application without calling Trace.Flush, TextWriterTraceListener.Flush, or TextWriterTraceListener.Close, some entries will probably not be written to the file. When you use a TextWriterTraceListener, it's always a good idea to explicitly close the file before the application exits. In a Windows application, you can accomplish this by handling an event such as Application.ApplicationExit. In a Windows service, you can respond to the OnShutdown or OnStop method. Otherwise, the file remains locked open and you can't delete or replace it. Note By default, both the Trace class and the Debug class share the same collection of listeners. In other words, the Trace.Listeners and Debug.Listeners properties both reference the same TraceListenerCollection. This means that any messages you write with Trace.Write are received by all trace listeners and any messages you write with Debug.Write are received by all trace listeners. If this isn't the behavior you want, you must manually create a new TraceListenerCollection at startup, assign it to the Trace.Listeners property, and then add the appropriate listener objects. Make sure you include an instance of the DefaultTraceListener class if you want messages to appear in the Debug window in Visual Studio .NET. You also can add trace listeners declaratively in the client application's .config file. This gives the user an easy way to specify the filename and enable logging by modifying a simple configuration file setting (as shown in Listing 14-10). Listing 14-10 Adding a listener with the configuration file<configuration> <system.diagnostics> <trace autoflush="true"> <listeners> <add name="FileListener" type="System.Diagnostics.TextWriterTraceListener,System" initializeData="c:\mylogfile.txt" /> </listeners> </trace> </system.diagnostics> </configuration> Trace Switches.NET tracing really shines with trace switches. So far, you've learned how to enable and disable tracing en masse. With trace switches, you can separate your trace messages into different categories and allow trace messages for a single category to be enabled or disabled. For example, you might group trace messages for business logic with one switch and group trace messages that indicate remote object invocations with another. The user can then log whichever set of trace messages is relevant to the current problem. You can also use trace switches to configure a variable level of detail for trace messages. There are two types of tracing switches:
Of course, none of this happens automatically. You need to inspect the properties of the BooleanSwitch or TraceSwitch class programmatically and then output the appropriate trace messages. To create a switch, you must first define it in the configuration file. The configuration file names the trace switch and sets its state. The user can therefore modify the configuration file to enable or disable logging or to change its detail level. In Listing 14-11, two trace switches are defined. One is a BooleanSwitch, which is used to enable or disable trace messages related to user interface, and the other is a TraceSwitch, which is used to configure the level of standard application-level trace messages. Listing 14-11 Defining trace switches<configuration> <system.diagnostics> <switches> <!-- In order to receive user interface related messages, change value="0" to value="1" --> <add name="UISwitch" value="0" /> <!-- In order to receive general trace messages, set value to something other than 0 (depending on the desired detail level) --> <add name="GeneralSwitch" value="0" /> </switches> </system.diagnostics> </configuration> Now, in your application code you must create an instance of the BooleanSwitch class and the TraceSwitch class, using the name defined in the configuration file: Private UISwitch As New BooleanSwitch("UISwitch", "User Interface") Private GeneralSwitch As New TraceSwitch("GeneralSwitch", "General") The only remaining detail is to inspect the UISwitch and GeneralSwitch and use that information to configure the tracing messages that the application outputs (as shown in Listing 14-12). Listing 14-12 Examining trace switches If UISwitch.Enabled Then Trace.WriteLine("User interface loaded", "UI") End If ' You could also use the equivalent syntax: ' Trace.WriteLineIf(UISwitch.Enabled, "User interface loaded", "UI") If GeneralSwitch.Level = TraceLevel.Verbose Trace.WriteLine("Application started at " & _ DateTime.Now.ToString(), "General") End If ' You could also use the equivalent syntax: ' If GeneralSwitch.TraceVerbose ' ' (Write message here.) ' End If Note Tracing is not limited to the client side. If you use the TextWriterTraceListener with server components, however, you need to take additional steps to ensure that every component writes to a unique file (to prevent locking and concurrency issues). You also need to track all these individual files. Because of the complexity of server-side logging, it's often more useful to design your own generic logger facade, interface (for example, the ILogger interface shown earlier), and logging components (for example, EventLogger). Catching Unhandled Errors.NET provides one interesting feature that's useful in reporting errors that aren't properly handled. A special event, AppDomain.UnhandledException, fires if an unhandled exception has occurred, just before the application is terminated. You can handle this event and use it as a last-ditch attempt to log an error. Here's how you attach an event handler: Dim CurrentDomain As AppDomain = AppDomain.CurrentDomain AddHandler CurrentDomain.UnhandledException, AddressOf UnhandledError The event handler receives the exception information from the UnhandledExceptionEventArgs. Public Sub UnhandledError(sender As Object, _ e As UnhandledExceptionEventArgs) Trace.Write(e.ExceptionObject.ToString(), "Unhandled Error") End Sub |
EAN: 2147483647
Pages: 174