Working with Database Fields
 |
| |||||||||
The Report Creation Wizard can be used only during the creation stage of report building. Once you have a report to work with, you add additional fields using the Field Explorer, shown in Figure 2.2.
Several additional fields were specified in the business question:
-
ResortCode
-
StreetAddress
-
City
-
StateProvince
-
PostalCode
-
Region
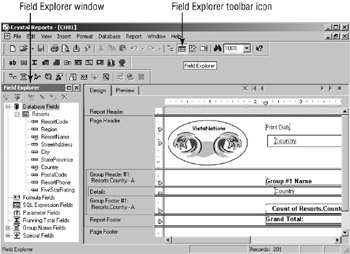
Figure 2.2. Field Explorer
While you can use the Field Explorer and other design objects in both Preview mode and Design mode, there is more help available to you as a report creator in terms of layout in Design mode than there is in Preview mode. Preview mode is ideal for seeing the visual effect as the user might see it.
| Warning | In Crystal Reports 9, you can no longer add fields using the Insert menu. |
The Field Explorer has been updated in Crystal Reports 9 and works as a kind of home base for all the work you do with fields while designing a report. When you click the Field Explorer toolbar icon, the Field Explorer window becomes anchored, or docked, to the left side of the design window, as shown in Figure 2.2. The Field Explorer icon works like a toggle switch: Click it once and the Field Explorer displays; click it again and the Field Explorer disappears. The Field Explorer window can also be detached from its docked position by dragging and dropping its title bar window. Once detached, the Field Explorer becomes a floatable window that you can leave floating over the design window or redock to the left, right, or bottom of the design screen.
The seven categories of fields listed in the Field Explorer are described in Table 2.1. We’ll go into more details on how to use each of the fields in subsequent chapters, and for now, we’ll focus on database fields.
| Field Type | Description |
|---|---|
| Database Fields | Fields that are stored in a data source table |
| Formula Fields | Calculated fields that evaluate to a result |
| SQL Expression Fields | Fields that perform a SQL calculation or expression |
| Parameter Fields | Fields that prompt users for values at runtime |
| Running Total Fields | Counting fields that increment in special ways |
| Group Name Fields | Custom named references for groups created in a report |
| Special Fields | Fields generated by Crystal that can be added to any report |
Adding a Database Field
With the Field Explorer visible on the design screen, you can add any number of additional fields to your report. If you had created a report using the As A Blank Report radio button visible in Figure 2.1, you would use the technique about to be described to add fields to the report instead of using the Report Creation Wizard.
The Database Fields option is the first item in the Field Explorer. This is handy because a good deal of what you add to a report is field data from a database. Figure 2.3 shows the Field Explorer as a floating window and with the Database Fields option expanded. You can collapse both the Database Fields option and the Resorts table option by clicking the minus sign.
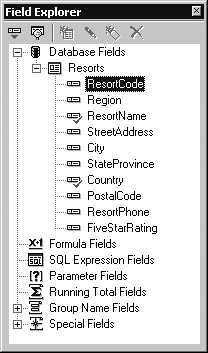
Figure 2.3. Database Fields
Figure 2.3 shows that this report uses the Resorts table as a data source and currently makes use of the ResortName and Country fields. The green check mark next to each field signals that the field is placed somewhere on the open report, which is nice information to know. You can reuse fields as many times as you need to, so the green check mark will not stop you from adding the field to the report again.
Field Explorer Buttons
At the top of the Field Explorer are six icon buttons that perform the following tasks on the selected (highlighted) field:
-
Insert the field into the report
-
Browse the data in the data source for the field
-
Create a new field
-
Edit the field
-
Rename the field
-
Delete the field
In the case of a database field, the only options available are to insert the field or browse its data; the remaining icons are grayed out because they don’t apply to the field.
Context Menus
We can also get more information about an individual field by using the context menu. Right-clicking an item displays an item-specific menu. For instance, right-clicking the ResortCode field (which is selected in Figure 2.3) displays the context menu shown in Figure 2.4. The context menu also shows the keyboard shortcuts for the mouse-oriented menu tasks.
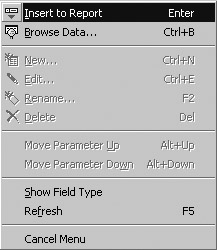
Figure 2.4. Field Explorer context menu
| Tip | Crystal Reports is very fond of context menus; whenever you’re wondering what you can do at a given point in the application, right-click the object of interest to see what’s available. |
Drag and Drop
The most popular way to add fields to your report still makes use of the Field Explorer but does so in a drag-and-drop operation (see Figure 2.5). You can select a field from the Field Explorer (including non-database fields) and drag it to the position on the report where you want it placed.
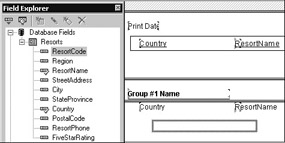
Figure 2.5. Dropping a field into position
As you’re dragging a field from the Field Explorer to a section in your report, a thick gray rectangle representing the field placement floats over the report until you let go of the mouse. Once you do, the field is positioned at the point where you let go of the mouse and the gray positioning rectangle disappears. During this drag-and-drop activity, the mouse pointer changes from a pointer to a circle with a diagonal line through it; the pointer is telling you whether or not it’s valid to drop the field at the position the mouse is on currently. A pointing arrow means that you’ve found a legal place to put the field; the circle with the line through it means that it’s illegal and you won’t be allowed to drop the field.
You can also use drag and drop to reposition any field, moving it to another location within the same section or into a different section entirely.
Field Placement
As you add fields to a report, you need to think about where you’re placing the fields. Two issues become very important in field placement: section management and visual aesthetics, or your ability to make fields look good on the piece of paper or screen on which it will ultimately be viewed. You can think of aesthetics in terms of physical placement, and there are several utilities to help you with that task, such as guidelines, grids, and rulers.
Sections
The primary concern in field placement involves in which section to place a field. The section you place it in can actually affect how the field behaves. As an example, recall that fields placed in report headers or footers display only once per report. If you dragged the ResortCode field into the Report Header section, then the resort code for the first resort in the database would appear as the only Resort Code value in the entire report. Hang on, though, weren’t there over 200 resorts? What about the other 199+ values that ResortCode has in each record of the database? Well, if you place the field in the Report Header, then only the first value in the database will display and all other values will be ignored.
The only section that guarantees that a value for every record in the database will appear in your report is the Details section. So if your goal is to list all the resort codes and resort names in the database, then you must position these two fields in the Details section. When the Report Creation Wizard generated the report for you in Chapter 1, it automatically put all database fields in the Details section so that a value would appear for each record in the database. When you don’t use the wizard for field selection, the burden is on you to make sure the field is placed in a section appropriate to its purpose.
| Warning | Crystal will not stop you from putting a field in any section; that part of the job is up to you. |
Guidelines
Each time you place a field on the report, guideline positioning markers are added to the rulers that border the design area. These guideline markers, visible on the ruler in Figure 2.6 as downward-pointing triangular shapes, can be used as both vertical and horizontal alignment aides. The ones in this figure are vertical placement guides.
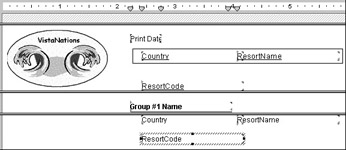
Figure 2.6. Vertical guideline markers
If you click a downward- or right-pointing icon marker on the ruler, a dotted line temporarily appears that represents the alignment line; this is a guideline. You can permanently show the guidelines by right-clicking the report background and selecting Guidelines > Design or Guidelines > Preview from the context menu, as shown in Figure 2.7. The guidelines themselves appear as dotted lines, which are visible later in Figure 2.11. You can drag the guideline markers to new positions on the ruler, which moves the dotted lines and all fields connected to the guideline to a new position uniformly.
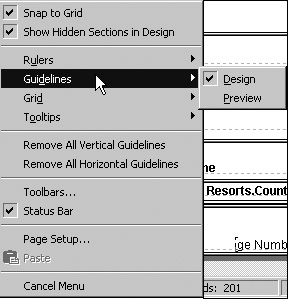
Figure 2.7. Activating guidelines
| Tip | Guidelines can also be turned on by choosing View > Guidelines and its submenu. |
Vertical Guidelines
When a field is added to the report, a vertical positioning guideline marker is added to the ruler at the top of the design area. If you move the guideline marker, all fields anchored to the guideline move with it. Newly added fields automatically have their own guideline. You can add fields to a vertical guideline by dragging and dropping a field close to the vertical alignment guideline. This can be handy when you’re trying to line fields up accurately beneath one other. If you move a field without using its guideline marker, it detaches from its guideline.
Since Crystal automatically generates a new vertical alignment guideline for every field you add to the report, the guidelines can result in clutter instead of clarity. Also, once you detach a field from a guideline, the guideline marker remains in place. You can remove unwanted vertical alignment guidelines by selecting them and sliding them off the ruler to the left or right. Since it is easy to remove guidelines, you could guess that it is also easy to add new ones; simply click in the ruler area to add a new guideline.
| Tip | Be sure to use vertical guidelines for reports that will be displayed in a Web browser; they are essential in helping report fields line up in a browser. |
Horizontal Guidelines
Unlike vertical guidelines, Crystal generates horizontal guidelines only when the Report Creation Wizard is used. When you add fields individually to a report using the Field Explorer, no horizontal guidelines are created for you.
You can manually add them, however, by clicking the ruler along the left edge of the design area. Removing them is done as before—slide the guideline marker off the end of the ruler.
The Alignment Grid
Horizontal and vertical guidelines can be used in conjunction with another alignment aide, the grid. The grid is made up of dots aligned vertically and horizontally that you can use to eyeball where you should place a field. As you place fields on the report, you can manually line them up at a grid position, or you can rely on the Snap To Grid option to automatically move a field onto the nearest grid line after you drop it onto the report. When you use grids and guidelines together, if the Snap To Grid option is enabled, shown as the first menu item in Figure 2.7, guidelines can be positioned only on top of grid lines.
| Tip | The grid can also be turned on by choosing View > Grid and its context submenu. |
For fine-tuning changes in alignment, use the arrow keys for very detailed and specific movement of selected objects one grid mark at a time. You can move fields up, down, left and right using the arrow keys on the keyboard and the mouse.
The Rulers
You’ve seen that having rulers along the top horizontal edge of the report and along the left vertical edge of the report can help you visually place fields. While alignment grids and guidelines don’t require the rulers to be visible, they are more useful when rulers are displayed. For guidelines, the hexagon at the border of the guideline does not show without rulers enabled. You can toggle the rulers off using either the context menu options Rulers > Design and Rulers > Preview or the menu sequence View > Rulers and its submenu.
Physical Placement
The grid, guidelines, and rulers can give you a good idea of how a field will ultimately look in relation to other items in the report. Switching to Preview mode frequently will also help you make good decisions on where to move fields and text. Crystal Reports allows you to place one field over the top of others in Design mode. When you take a peek at your work in Preview mode, check to make sure that you’ve adhered to all the following placement practices:
-
Fields are not overlapping.
-
Fields are horizontally aligned.
-
Fields are big enough to display their data.
Tip For help with fixing these problems, try the menu options Format > Move, Format > Align, and Format > Size.
Deleting Fields and Labels
Deleting a field or a column label from a report is a simple matter in either Design mode or Preview mode:
-
Click the field to select it.
-
With the square resize blocks on the field visible, press the Delete key on the keyboard.
You can delete multiple selected fields as well. You select multiple fields by holding down the Ctrl key and selecting each individual field with a mouse click, or you can draw an expanding selection rectangle around the fields to capture all fields inside of it. To draw a selection rectangle within a section, hold down the left mouse button and draw a border on the outside of all fields you want to capture. (This technique does not work across sections.)
| Tip | If column titles are self-explanatory with the label, deleting them can reduce the cluttered look of a report. |
Visual Checkpoint: Fields
At this point, we’ll assume that the additional fields for ResortCode, StreetAddress, City, StateProvince, PostalCode, and Region have been added to the report and positioned in a visually appealing way, as in Figure 2.8.
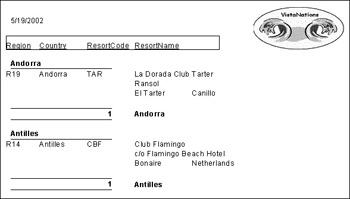
Figure 2.8. New fields added
Several design techniques were used in the field placement visible in Figure 2.8:
-
The StreetAddress and City fields were dragged beneath the ResortName field and dropped on the guideline for the ResortName; when you drag the guideline, the three fields will move as a group.
-
The column labels for StreetAddress, City, StateProvince, and ZipCode were deleted.
-
The column labels for Country, ResortName, and ResortCode were selected as a group, and the menu sequence Format > Align > Bottoms was used to force all three to be horizontally aligned with one another.
-
The Region field was added to the left of Country.
-
The logo was moved to the right.
-
The PrintDate field was moved toward the left margin.
-
The Group field was left-aligned on the margin.
Tip You can activate the Align menu by right-clicking a set of selected objects.
Adding fields to a report can go a long way in satisfying changing business requirements, as it has in our case. We’ve satisfied the additional database field requirements of the business question and cleaned up the report along the way.
| Use of content on this site is expressly subject to the restrictions set forth in the Membership Agreement | |
| Conello © 2000-2003 Feedback | |
EAN: 2147483647
Pages: 217