Automated Responses
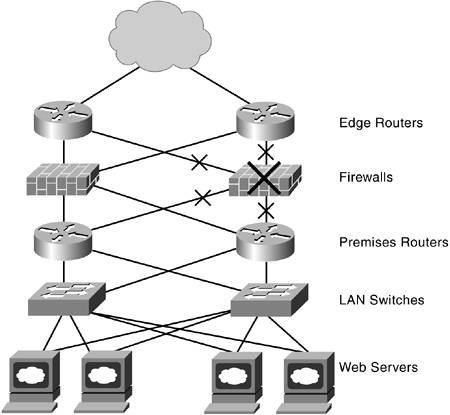
| Automated responses are another key real-time function; they are activated after an alarm is detected or after another tool, such as root-cause analysis, has done its task. Automation was initially introduced to reduce staff effort and errors by automatically initiating corrective actions or collecting information for further staff attention. Taking over repetitive tasks, such as making regularly scheduled measurements or setting configurations for groups of elements, saves substantial labor and reduces the errors and inconsistencies that occur with manual input. Automation also speeds up processes because they do not demand staff attention; they are activated as needed without waiting for permission. Speeding up processes is always valuable, but you reach a point where more speed may not give the leverage you seek. The new challenge is not just speeding up a simple task and continuously shrinking the window; it is about using the same time window for making more complex, intelligent decisions. Languages Used with Automated ResponsesAutomated responses were originally constructed using scripting languages such as PERL, which allowed the quick creation of simple scripts. Other responses were created with programs that could handle more complex situations, but they also took longer to create and modify. Many organizations are using Java for its easy implementation, widespread usage on many types of computers, and the advantages of using a component-based approach. New automated response mechanisms can be created quickly by reusing previously developed software components. A Case StudyTo better understand how automated responses work, consider the set of actions needed after a root-cause analysis has identified a failed element. The management team is more effective when it is addressing the most critical problems and keeping business processes functioning. Any task, such as addressing a failed element, must be prioritized against other tasks demanding staff time and attention. The impact of element failure must be assessed in real time to make the best decisions (by management tools or by staff). In the example in Figure 6-4, you can see that distinct steps are involved. Each step is discussed in the following subsections. Figure 6-4. Example of an Automated Response
Step 1: Assessing Local ImpactIn this case study, a simple application traces the topology information from the failed element, which is the firewall marked in Figure 6-4 by a large X. It determines the neighboring elements from the connectivity information, checks each neighbor for remaining redundancy, and then discovers the impacted elements (marked with small X's). Both edge routers and both premises routers are affected by the firewall failure. Redundancy is temporarily disabled in this case because each router has only one connection left to other parts of the physical infrastructure. The topology information is supplied by the enterprise management platform. The application uses the published schema and application program interface (API) to collect the topology information it needs. Note that future plans could include conversion to the Common Information Model (CIM) specified by the Distributed Management Task Force (DMTF). Step 2: Adjusting ThresholdsThe neighboring elements now present different risks as failure and choke points. Decisions on adjusting the thresholds for the neighboring elements are needed. One matter is that the load on neighboring elements will suddenly jump because all the traffic has been funneled to the remaining routers as a result of the failure. Although failed elements are offline, thresholds for the "good" elements need to be adjusted to reflect the new system configuration and resulting changes in loading levels; otherwise, a steady stream of alerts will be generated based on the old values. Warning and severity levels might also need to be adjusted for more sensitivity because the neighboring elements are the most sensitive in the delivery chain. Measurement intervals might also be adjusted for tracking behavior more finely until the risk is eliminated. Step 3: Assessing HeadroomThe remaining routers will naturally take on a heavier load. The headroom is the difference between the current offered load and the maximum usable capacity of the routers. A larger amount of headroom reduces sensitivities to traffic variations, although adding headroom can be costly. The risk of non linear degradation grows when the capacity margins diminish. Step 4: Taking ActionThe next step is the taking of a set of actions to reduce and eliminate the risks of further disruptions. The actions involved in this step are as follows:
Step 5: ReportingReal-time reports are generated for browser access by members of the operations team and the group responsible for configuring the automated systems. They include the following:
Building Automated ResponsesAlthough automation has many benefits, it's easy to get carried away and create software so complex that it doesn't hold up under fire. One of the keys is keeping it simple and modular. This approach fits well with a component-based approach that allows easy reuse and combination with other modules to build new functionality. Picking Candidates for AutomationThere are a large number of potential candidates for automation. Organizations with an abundance of staff and resources can attack all of them; most real-world shops must select their targets more carefully. Information from the help desk or trouble ticketing system can be used to help pick the processes and actions that deliver the greatest benefit for a specified investment of time and energy. Some metrics that point toward likely automation candidates are as follows:
|
EAN: 2147483647
Pages: 128