A Case Study on Metadata Application Design
Because of the subtleties of metadata design, we work through a case study in enough detail to point out where the metadata design was introduced. As we see later, this knowledge is the keystone to effective semantic design. The case is based on a real project.
The business problem involves a company that mines and processes an industrial mineral, diatomaceous earth (DE). The firm's information technology (IT) department, in conjunction with outside consultants, was asked to convert their QC lab from manual systems to a computer system (in 1992). At that time they believed (based on their largely handwritten spreadsheets) that they had about two dozen tests. A first-cut, traditional design modeled each test as a column in a test table.
A metadata-inspired design was proposed and implemented. Before the system was completed, the design had paid for itself many times over. By the time of conversion, nearly 100 tests (mostly customer-specific variations on tests) had been uncovered and implemented in the system. What would have been nearly 100 significant changes to the system were accommodated with no change. There are now (10 years later) millions of test results and more than 300 test types in the system. The system has outlived the obsolescence of its hardware, operating system, and database, as well as Y2K, with only a few maintenance changes along the way.
Diatomaceous Earth
DE is the sedimentary remains of the exoskeletons of diatoms. A diatom (Figure 6.10) is a single-celled creature. (Technically diatoms are members of the kingdom Protista and are neither plant nor animal.) Diatoms are most closely related to algae; however, they often have intricate silica-based shells or exoskeletons. Millions of years ago, they were deposited on the bottom of seas and lakes to eventually be compressed into sedimentary rock, chalklike in appearance.
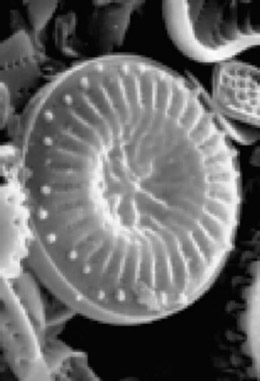
Figure 6.10: A diatom. (Photograph by P. Roger Sweets.)
Once mined and processed, DE has an amazing array of properties. Among its many applications, it is used to filter beer and wine, to make paint less reflective, to make Saran Wrap less sticky, and to make toothpaste more abrasive.
Quality Control
Quality control for DE is similar to that for other process manufacturing industries. When producing, say, beer-grade DE, the plant will set the process control levers at a particular setting, and then the QC department will take samples ("in process" and of packaged finished goods) to ensure that the product is staying within preset tolerances. (At this level, the process is no different than making soft drinks or synthetic blood.)
Quality Control Procedures
The QC team will have a set of procedures for taking samples (including the number, frequency, and method of obtaining them), as well as procedures for the tests to be performed. Each sample type should have a template for the tests to be done, which can then cross reference to the specific procedures. This is especially useful for infrequently performed tests.
Lots and Samples
Each lot will have many samples, as shown in Figure 6.11. One or more tests are done for each sample. The results are averaged, and often statistical tests are performed to determine the deviation from the target values.
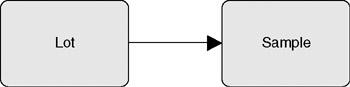
Figure 6.11: Any lot can have many samples.
Results and Control Limits
Typically either the average of the samples or the range of standard deviation of the samples is compared with the target values (usually an upper and lower limit, as in Figure 6.12).
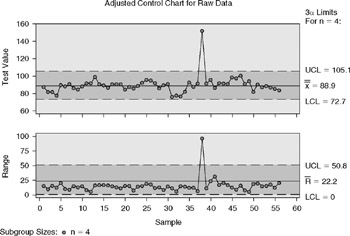
Figure 6.12: Control charts showing actual results compared with control limits.
Alpha Time
Alpha time is the length of time it takes a predetermined percentage of a standard volume of distilled water to pass through a standard amount of DE in a standard-size container. Low (i.e., fast) alpha times indicate large, porous diatoms, which are more suited to filtering material with more particulates.
Wet Density
Wet density is a measure of how heavy a given volume of DE is after being soaked in a fixed volume of distilled water. It is a measure of the smaller openings in the diatoms.
First-Cut Database Design
Let's say we decided to design our database to allow us to take alpha time and wet density samples and average them per lot.
Figure 6.13 is one of many possible designs. The "result" table is shown in dashed lines, because depending on the volume of data and inquiries, you may choose to build that table dynamically, when necessary.
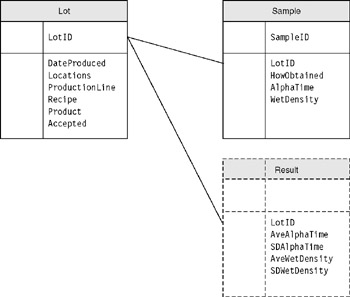
Figure 6.13: An early, typical relational design of the QC system.
The "lot" table is created by the production scheduler when we decide to make a "lot." It contains information about the lot itself (when it was made, where, what we were trying to make, etc.). There will be one row in this table for each lot that we produce.
The "sample" table will have one row for each sample we take. Each sample is cross referenced to the lot it came from, and there may be some information about the methods that were used to take the sample.
Figure 6.14 is approximately the same design, in table form, with some sample data. The test data in Figure 6.14 show six samples taken from two lots. For each sample there was a measurement of alpha time and wet density. These were then averaged, and a standard deviation was calculated in the results table.
| LotID | ||||
|---|---|---|---|---|
| LotID | DateP | Loc | Product | Accepted |
| 112 | 20-Dec | WA | DEFlo | Y |
| 113 | 20-Dec | WA | DEFlo | Y |
| Sample | ||||
|---|---|---|---|---|
| Sample | LotID | HowOb | AT | WD |
| 2700 | 112 | Bag | 25 | 101 |
| 2701 | 112 | Bag | 29 | 104 |
| 2702 | 112 | Bag | 24 | 99 |
| 2703 | 113 | Silo | 32 | 120 |
| 2704 | 113 | Silo | 32 | 121 |
| 2705 | 113 | Silo | 31 | 111 |
| Result | ||||
|---|---|---|---|---|
| LotID | AveAT | SDAT | AveWD | SDWD |
| 112 | 26.00 | 2.65 | 101.33 | 2.52 |
| 113 | 31.67 | 0.58 | 117.33 | 5.51 |
Figure 6.14: The original design, with test data. AT, alpha time; SD, standard deviation; WD, wet density.
You can imagine the use cases for this design:
-
Start a new lot—This sets up a record in the lot table.
-
Take a sample—This records where the sample was taken from and some information about what was to be made.
-
Record measurements—If the alpha time and wet density are done at different workstations, potentially by different people, each test could have its own queue of samples to process.
-
Lot closeout—Review the results, make sure there are no outstanding tests, and determine whether the lot passed or failed. (This implies that the control intervals are either in another table, not shown, or are done manually.)
Change at the Metadata Level
It's not hard to imagine what the most likely change in this type of situation is (even if the users swear it never changes, you can be pretty certain it will have changed by the time you finish the implementation). A new test is required. It may be a variation on an existing test, but one where you can't mix and match test results (there are several different alpha time tests, each with a different volume of material and water, for products of widely differing porosity).
The first impact of the change is a metadata change: We now need a new column on the sample table and the results table. But that's only the beginning, because the use cases have been affected. The screens used to enter the measurements will have to be adjusted.
At some point (after the fourth or fifth new test has been incorporated via a system change), it will become apparent that not all of the tests have to be done for all of the samples. Initially this will be handled with programming logic, but eventually the developer will realize a need to do something else.
One of two things usually happens at this point: Either the developers become skilled at making these changes (which have now become routine), or they realize that this change has become the norm, and it is time for a new design that incorporates that. This new design moves some of what was the metadata (the definition of the tests) into primitive data.
Who Gets to Mess with the Metadata?
When it comes down to it, the question is, Who gets to mess with the metadata? Historically this has been reserved for data administrators and the like. It was too dangerous for mere mortals (end users). But it turns out that, in many cases, the metadata can be expressed as ordinary data, as long as there are safeguards to prevent its misuse.
New Design
The "sample" table in Figure 6.15 now no longer has a column for each test. Instead it now has two columns, one to describe the type of test and the other for its value. For the same amount of data, the table is now longer, but this turns out to be insignificant in all but the rarest circumstances.
| LotID | ||||
|---|---|---|---|---|
| LotID | DateP | Loc | Product | Accepted |
| 112 | 20-Dec | WA | DEFlo | Y |
| 113 | 20-Dec | WA | DEFlo | Y |
| Sample | ||||
|---|---|---|---|---|
| Sample | LotID | HowOb | TestType | TestValue |
| 2700 | 112 | Bag | AT | 25 |
| 2701 | 112 | Bag | AT | 29 |
| 2702 | 112 | Bag | AT | 24 |
| 2703 | 113 | Silo | AT | 32 |
| 2704 | 113 | Silo | AT | 32 |
| 2705 | 113 | Silo | AT | 31 |
| 2700 | 112 | Bag | WD | 101 |
| 2701 | 112 | Bag | WD | 104 |
| 2702 | 112 | Bag | WD | 99 |
| 2703 | 113 | Silo | WD | 120 |
| 2704 | 113 | Silo | WD | 121 |
| 2705 | 113 | Silo | WD | 111 |
| TestType | ||
|---|---|---|
| TestType | LoValid | HiValid |
| AT | 20 | 40 |
| WD | 80 | 150 |
| Result | |||
|---|---|---|---|
| LotID | TT | Ave | SD |
| 112 | WD | 101.33 | 2.52 |
| 113 | WD | 117.33 | 5.51 |
| 112 | WD | 101.33 | 2.52 |
| 113 | WD | 117.33 | 5.51 |
| 112 | AT | 26.00 | 2.65 |
| 113 | AT | 31.67 | 0.58 |
| 112 | AT | 26.00 | 2.65 |
| 113 | AT | 31.67 | 0.58 |
Figure 6.15: A metadata-inspired design.
If we did nothing else, we'd be guilty of lack of semantic precision. If we stopped the design change at this point we could type anything in the Test-Type column. (This is a common design error.) The problem is that if you use different names for a single test (e.g., alpha time, Alpha time, AT), when you go to search or summarize, one of them will be missing.
The new design introduces a new table, the TestType table. The TestType table has a row for each valid test type. Requiring that the TestType column in the sample table be validated to the TestType table is straightforward.
Note that we now have a convenient place to put valid ranges for the tests. These are not the upper and lower control intervals, which are specific to the product being produced (and potentially the process being used), but they do provide a handy place for basic validation (especially for order-of-magnitude errors, which are common in this type of system).
It doesn't take much to extend this design to add a table that asks two things: Which tests do I want to do for which products? And, on the same table, what are the upper and lower control intervals?
Columns-to-Rows Pattern
What I just described is a powerful pattern that we call the columns-to-rows pattern. As you can see in Figure 6.16, data is being shifted from column headings to rows (instances).
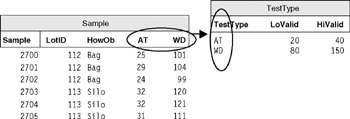
Figure 6.16: The columns-to-rows pattern.
Is It Still Metadata?
At one level, this doesn't look like metadata any more. It was metadata when it was a column heading (and in the data dictionary, etc.). But when we shifted it, it became ordinary data.
Don't let this fool you. This is metadata, just as much as it was when it was a column head. It is metadata because the data in the TestType table are very much data about the data in the Sample and Result tables.
If the system is designed properly, it should be just as impossible to add a row to the sample table with a bogus test type as it would have been to stick a nonexistent column on the end of the old sample table. This does, however, shift some of the responsibility to the application developer.
Enforcement and Visibility Shift
Some other things have shifted in this scenario. The test types are no longer visible to a traditional metadata tool (e.g., a report writer running off a database). This doesn't mean that reporting is not possible; in fact, it is more flexible in this scenario. It just means that the application has to play a role. Where columns were selected before, now there will be query pieces. For example,
Select Sample.AT From Sample Where LotID = 112
Is now
Select Sample.TestValue from Sample Where LotID = 112 AND Sample.TestType = "AT"
Is There More Metadata or Less in the New Solution?
This is an interesting question. In the first example we had 3 tables, each of which had 5 columns, for a total of 15 pieces of metadata. In the second design we had 4 tables with a total of 17 pieces of metadata.
Now look at what happens when we add new test types. In the original design the explicit metadata grows every time we add a new test type. Along with that, all the code that accesses the metadata is affected.
In the new design, adding a new test type does not affect the (official) metadata at all. Nor is the code affected, unless there were hard-coded SQL routines that took advantage of knowledge of a value in the TestType table.
Epilogue
The case study described here was converted from a manual system to a computer system 10 years ago. At that time they believed (based on their large, handwritten spreadsheets) that they had about two dozen tests, and the original design was the more traditional design, with two dozen columns.
The meta design paid off even before the system was converted. By the time the system was converted, nearly 100 tests and variations had been uncovered. At a recent review (10 years later), there were 336 tests in the system (some obsolete and retained only for historical purposes). Although it would have been possible to continue with the traditional design, it would have involved more than 300 system enhancements over that period. As it was, there have been few changes to the system as the users of it have extended it to meet their needs.
EAN: 2147483647
Pages: 184