4.5 Identifying and Developing Flows
4.5 Identifying and Developing Flows
Flows can usually be identified and developed from information in the requirements specification: user, application, device, and network requirements; user and application behavior (usage patterns, models); user, application, and device location information; and performance requirements. The more thorough this information is, the better the resulting flows will be.
At this point in the analysis process, we have sets of requirements and mappings of application and/or device locations. We have not made any choices of networking technologies, network devices, or vendors. During the flow analysis process, we must not constrain flows to existing networks, topologies, or technologies. We want to be free in determining the compositions and locations of flows for our network so that the flows drive our architectural and design choices. Thus, flows are determined based on the requirements and locations of the applications and devices that generate (source) or terminate (sink) each traffic flow.
The process for identifying and developing flows consists of identifying one or more applications and/or devices that you believe will generate and/or terminate traffic flows. Once you have chosen which applications and devices to focus on, you will use their requirements from the requirements specification and their locations from the requirements map. Based on how and where each application and device is used, you may be able to determine which devices generate flows and which devices terminate flows (flow sources and sinks, respectively). Some common flow models are provided in Section 4.7 to help you with this process. Once you have identified each flow and determined its composition and location, you will combine the performance requirements of flows into a flow specification. This process is shown in Figure 4.7.
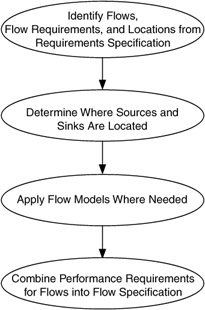
Figure 4.7: Process for identifying and developing flows.
From an application perspective, some common approaches to identifying flows include:
-
Focusing on a particular application, application group, device or function (e.g., video conferencing, storage)
-
Developing a "profile" of common or selected applications that can be applied across a user population
-
Choosing the top N (e.g., 3, 5, 10, etc.) applications to be applied across the entire network
You may choose to consider doing some or all approaches for your network. Each approach is outlined in the following sections.
4.5.1 Focusing on a Particular Application
When focusing on an application, application group, device, or function, you are considering one or more applications that will likely drive the architecture and design— those that are high performance, mission-critical, rate-critical, real-time, interactive, predictable, and/or guaranteed. By focusing on one or a few applications, you will be able to spend more time determining their flows, as opposed to spreading your time across many applications. Choose what you are focusing on and select that information from the requirements specification.
4.5.2 Developing a Profile
Sometimes a set of common applications applies to a group of users or to the entire set of users. When this is the case, a profile or template can be developed for those applications, and each flow that fits the profile is identified with that profile's tag. Thus, instead of trying to replicate flow information for similar flows, you can use the profile, saving time and effort.
There are also times when flows have the same performance requirements, regardless of whether they share the same set of applications. When flows have the same performance requirements, a profile can be used to simplify their information as well.
Figure 4.13 shows a profile applied across the user population for Application 1 in Example 4.1. Instead of showing identical performance requirements at each flow, a common profile is shown for flows with the same performance requirements. This helps reduce duplication of information on the map, also reducing clutter.
Example 4.1: Data Migration
From the requirements specification, for a single session of each application:
Application 1—staging data from user devices
Capacity, 100 Kb/s; delay, unknown; reliability, 100%
Application 1—migrating data between servers
Capacity, 500 Kb/s; delay, unknown; reliability, 100%
Application 2—migration to remote (tertiary) storage
Capacity, 10Mb/s; delay, N/A; reliability, 100%
You can use the location information to map out where the users, applications, and devices are and develop a map if you do not already have one. Figure 4.8 is an example of such a map.
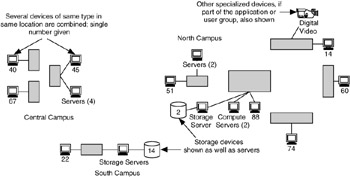
Figure 4.8: Map of device locations for a network.
Using the information on user and application behavior, you can determine or estimate where flows will occur. This can be between networks, device groups (better), or individual devices (best). Figure 4.9 shows where flows will occur between devices for Application 1.
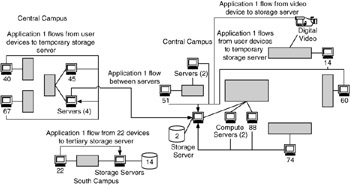
Figure 4.9: Flows estimated between devices for Application 1.
Once flows are mapped, you can apply performance information to each flow. Figure 4.10 shows this for the central campus portion of the storage application environment. Although in Figure 4.9 flows are shown between devices, Figure 4.10 simplifies this view by showing flows between buildings. Either method can be used, depending on the size of the environment and number of flows that you need to show. Usually the first method (Figure 4.9) is used to estimate where flows will be, and then the second method (Figure 4.10) is used to simplify the flow diagram.
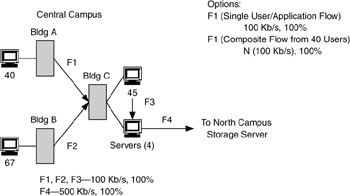
Figure 4.10: Performance information added to central campus flows for Application 1.
In Figure 4.10, flows F1, F2, and F3 represent the single-session performance requirement for each building for Application 1. At some point in this process, the performance requirement will need to be modified to represent the estimated performance required by all users in each building (40, 67, and 45 users in the buildings at the central campus). F4 represents the performance requirement for the server-server flow between the central and north campuses.
Note that in Figure 4.10 flows F1 and F2 are between Buildings A/B and C, and flow F3 is between devices. Given that the 45 user devices and the 4 servers are in the same building, we have to show the flows between devices. If we were showing flows within Building C, it would look like Figure 4.11.
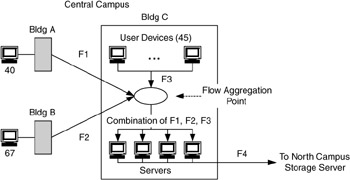
Figure 4.11: Central campus flows for Application 1 expanded with Building C.
Figure 4.11 also introduces a flow aggregation point, which allows us to show multiple flows being consolidated at a location. This will be useful in the design process, when we are looking at technologies and interconnection strategies for such locations in the network. For example, Figure 4.12 shows what flows will look like between buildings with and without a flow aggregation point.
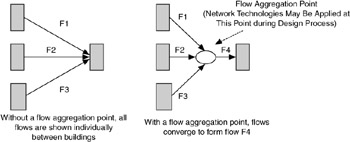
Figure 4.12: Consolidating flows using a flow aggregation point.
In Figure 4.13, P1 is the profile tag assigned to flows that have performance requirements (capacity = 100 Kb/s, reliability = 100%). There are six flows (tagged P1) in this diagram with those performance requirements. Other flows in Figure 4.13 have different performance requirements. For example, flow F4 (also shown in Figures 4.10 and 4.11) has performance requirements (capacity = 500 Kb/s, reliability = 100%). Flow F5 combines the performance requirements of 51 users (which, for Application 1, would be P1) with those of the 2 servers in that building. Flow F6 combines the performance requirements of 14 users (again, this would be P1) with that of the digital-video device. Flow F7, like flow F5, combines the performance requirements of users (88 in this building) with those of the 2 compute servers.
Note that Figure 4.13 shows flows as arrows between buildings and between devices within a building (except for flow F4, which in this example is easier to show as a flow between devices than as a flow between buildings). We could also choose to show the flows just between devices, as in Figure 4.9. If you compare these two figures, you will see that showing arrows between buildings simplifies the diagram. However, you may need to complement such a diagram with diagrams of flows within buildings, such as that shown in Figure 4.11.
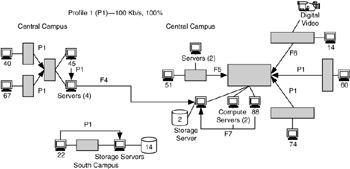
Figure 4.13: A performance profile (P1) applied to multiple flows with the same performance characteristics.
4.5.3 Choosing the Top N Applications
Finally, choosing the top N applications for your network is a combination of the first two approaches. It is similar to the first approach, but instead of 1 particular application (or maybe 2 applications), you use 3, 5, 10, and so on. It is also similar to the second approach in that the result can also be an application profile. These applications are the "top N" in terms of helping with the success of that organization, which may be inferred by their degrees of usage, number of users, number of devices/servers, or performance requirements. For example, the top five applications may be:
-
Web browsing
-
Email
-
File transfer
-
Word processing
-
Database transactions
This approach reduces the set of possible applications to a number that can be analyzed. However, when you eliminate applications from this set, you need to ask the question, "If I meet the requirements of these top N applications, will the requirements for those applications I eliminated be met?" The intent of this approach is to determine which applications represent the most important requirements for that network. These "top N" applications are likely to be the performance drivers for the network. As such, if you meet the needs of these applications, you are likely to meet the needs of all applications for that network. This will be described in more detail during the development of the flow specification.
The list of "top N" applications should be as precise as you can make it. For example, Application 5 (database transactions) may actually be timecard data entry into an enterprise resource planning (ERP) database. This would be a more precise description, resulting in more precise flow composition and location information. When possible, include usage scenarios for each application.
You may also use different approaches for different parts of the network. For example, it is common to have the top N applications that apply everywhere; profiles for selected locations; and focus on an application, device, or group in other locations, as in Figure 4.14.
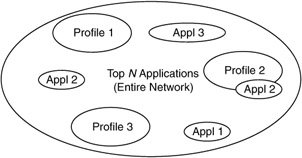
Figure 4.14: A project may incorporate multiple approaches in choosing applications.
EAN: 2147483647
Pages: 161