Working with Form Library Data
Now that you have had some experience working with your form library, you are ready to dig a little deeper and look at how to analyze all of that form data that you have been collecting. Up until now, you have been looking at your form data through a standard view, in which all the form data is shown in a table.
To analyze data, SharePoint also provides a datasheet view that allows you to view and edit the data in a spreadsheet-like interface with rows and columns of data. In addition to being an easier interface to navigate, the datasheet view also provides the ability to export and link data to other Microsoft Office products, including Excel and Access, for further analysis and reporting.
The following sections describe how to use the datasheet view and related Office tools to analyze your form data and turn this data into decision-making information, starting with a look at the datasheet itself.
Editing in a Datasheet
To invoke the datasheet view of your form library data, click the Edit in Data Sheet button, which changes the display of your data, as shown in Figure 12-16.
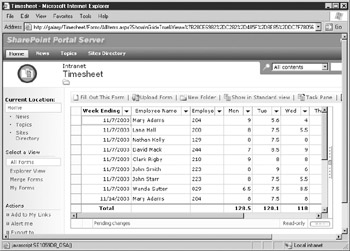
Figure 12-16: Datasheet view
Notice that the columns are exactly the same as in the standard view and that each column has a drop-down list shown on top of the column heading. You can use these drop-down lists to select the sort order for the sheet, as well as to filter the sheet contents.
To create a filter to narrow the data shown in the datasheet, use the drop-down list above the column you want to use in your filter to select the Custom Filter option. This opens the Custom Filter dialog box, shown in the following illustration, which allows you to enter the criteria to be used when filtering this view.
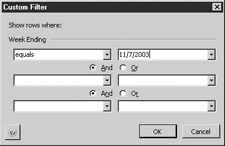
Using this dialog box, you can enter up to three different criteria based on this field, with either an And or Or operator between them. You can use the drop-down lists provided to select one of the following operators:
-
Is Equal To
-
Is Not Equal To
-
Is Greater Than
-
Is Less Than
-
Is Greater Than or Equal To
-
Is Less Than or Equal To
-
Begins With
-
Contains
Then, you can use the drop-down list on the right to select a value to be evaluated or you can type a value in the box provided. When you are finished, click OK to accept your filter criteria and return to the datasheet view, which should now only show the rows of data that meet the criteria you entered.
| Tip | To show all the records again, select Show All from the drop-down list at the top of the column. |
From within the datasheet, you can also edit the underlying InfoPath forms that provided the data shown. To edit form data, right-click within the datasheet and, from the right-click menu, select Document | Edit Document. This launches InfoPath on your computer and allows you to edit the form data. When finished, click the Save button within InfoPath to save your form data back to the form library.
Analyzing Form Library Data with Excel
In addition to controlling how your form data will appear, the datasheet also provides a powerful set of tools for analyzing form data, including links to Office programs, such as Excel. Using the features found within the datasheet, you can export form library data to Excel and use Excel spreadsheets to print form data, creating charts and graphs, and analyze form data using pivot tables. The following sections cover how to do these tasks and more.
Viewing and Printing
Excel’s strength lies in the ability it provides to analyze large amounts of information. And a tight integration with SharePoint makes it easy to extract form library information. To export your form library data, navigate to the main page of your form library (which, in this chapter’s running example, is http://servername/Timesheet/ Forms/AllItems.aspx) and make sure you are in the datasheet view. Next, click the Task Pane button in the toolbar above the datasheet to open the task pane to the right of the datasheet.
To export your form library data to a linked Excel spreadsheet, use the down arrow at the bottom of the task pane to scroll down to the Export and Link to Excel link. When you click this link, a separate process will launch and open Excel on your computer and display your form library data in a new spreadsheet as a list, like the spreadsheet shown in Figure 12-17.
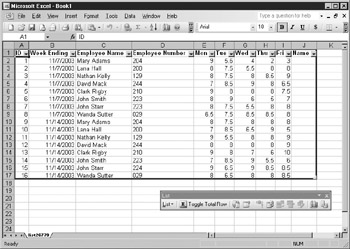
Figure 12-17: A spreadsheet with exported and linked form data
| Tip | You may receive a warning message about linking to external data and another warning message about linking to SharePoint. In both cases, click Open or OK to proceed, because the export process is a relatively low security risk. |
You’ll find that because the information is linked to your form library data, you won’t be able to change any of the values presented, but you can use the data as you would with any other spreadsheet and apply formulas, formatting, and so on, as required.
| Note | In addition to exporting and linking to Excel, the datasheet view also enables you to print form library data directly through Excel. This feature uses the same process just described, except that when the Excel spreadsheet is generated, the Print dialog box is immediately called and will print the spreadsheet. |
Charting and Graphing
If you want to perform some quick graphical analysis on your form library data, nothing beats a chart or graph to get the point across. From the datasheet view, you can directly invoke the graphing engine within Excel to create charts and graphs from your form library data.
To create a chart or graph from your form library data, make sure you are in the datasheet view and then use the down arrow at the bottom of the task pane to scroll down to the Chart with Excel link. When you click this link, a separate process will launch and open Excel on your computer, display your form library data in a new spreadsheet as a list, and invoke the Chart Wizard, shown in Figure 12-18.
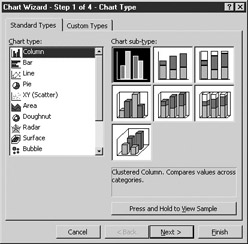
Figure 12-18: Chart types
In the first step of the Chart Wizard, you need to select a chart type to be created. There are a number of different chart and graph types available:
-
Column
-
Bar
-
Line
-
Pie
-
XY (Scatter)
-
Area
-
Doughnut
-
Radar
-
Surface
-
Bubble
-
Stock
-
Cylinder
-
Cone
-
Pyramid
Once you select a chart type, the right half of the dialog box displays a number of subtypes that are available, with different formatting options, orientation, and so on. To see what your chart would look like, select a subtype and then click the Press and Hold to View Sample button to display a preview of your chart. When you are happy with the results, click to select the subtype that you want to create and then click Next to proceed to the next step in the Chart Wizard.
| Tip | If you don’t see the chart type you want, you can always click the Custom Types tab to create your own custom chart type. |
The next step of the wizard (illustrated in Figure 12-19) is used to select the data that will be used for your chart. By default, your form library data from your spreadsheet will be selected but you can narrow or increase this selection by entering a cell range in the text box provided or by using the selector to grab a range of values.
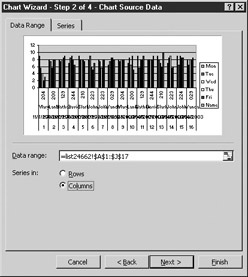
Figure 12-19: Data options
When you are finished selecting your data range, click Next to proceed to the next step of the wizard (shown in Figure 12-20, labeled Chart Options).
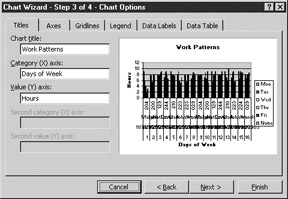
Figure 12-20: Chart options
This dialog box enables you to change different chart attributes, including the chart title and options for the chart’s axes, gridlines, legend, and more.
| Tip | All of these formatting options and attributes are also available after your chart has been created, so if you don’t know exactly what you want, you can always come back later and change these options or attributes. |
When you are finished changing these settings, click Next to proceed to the last step in the Chart Wizard, where you can select the chart location. You can place the chart either as a new sheet within your workbook or as an object in an existing workbook. To finish the Chart Wizard, click the Finish button to add your chart or graph to the location you have specified. It couldn’t be easier! You can now format the chart as you normally would within Excel, adding titles, gridlines, and so on, to suit your needs.
Analyzing Form Library Data with Access
Another popular method of analyzing form library data is to use Microsoft Access to create queries and reports to transform data into decision-making information. The following sections look at how you can export form library data to Access, create tables that are linked to your form library, and create queries and reports from your data. The first section looks at the easiest method that you can use to analyze form data—do a one-off export of the data to an Access database.
Last, but certainly not least, in the bag of Excel tricks is the pivot table. If you haven't worked with pivot tables before in Excel, they are a special formatting structure that allows you to calculate and show summary values by specifying rows, columns, and fields to be calculated.
Pivot tables are a great way to display form library data because they can be used to summarize thousands of rows of data into a succinct summary format. To create an Excel pivot table from your form library data, make sure you are in the datasheet view and then use the down arrow at the bottom of the task pane to scroll down to the Create Excel Pivot Table Report link.
When you click this link, a separate process will launch and open Excel on your computer, display your form library data in a new spreadsheet as a list, and invoke the pivot table dialog box, shown here.
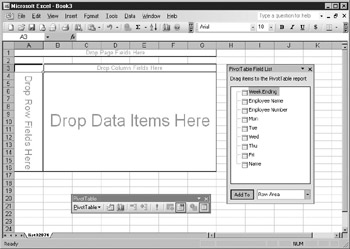
To create your pivot table report, drag fields from the field list to the areas marked Drop Row Fields Here, Drop Column Fields Here, and so on. As you drag rows, columns, and data items, Excel will crunch your form library data and display a summary based on the rows and columns you have selected.
Exporting Form Library Data
If you need to quickly analyze form library data as a one-off task or collate the data in a format that you can share with users outside your organization, exporting the form library data to Access is an easy method you can use. When you export the form data to Access, you are creating a separate copy of the data that you can then analyze and send to users outside your organization, as opposed to creating a “linked” table that remains tied into your form library and is automatically updated. (Creating linked tables is described in the next section.)
To export your form library data, navigate to the main page of your form library (http://servername/Timesheet/Forms/AllItems.aspx in the example) and click the Edit in Datasheet button to open your form library data in a datasheet view. Next, click the Task Pane button in the toolbar above the datasheet to open the task pane to the right of the datasheet, like the one shown in Figure 12-21.
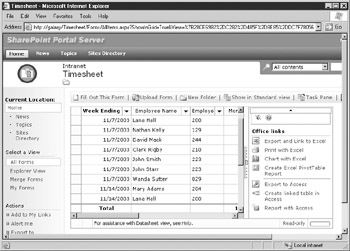
Figure 12-21: Task pane options
To export your form library data to Access, use the down arrow at the bottom of the task pane to scroll down to the Export to Access link. When you click this link, the task pane changes and prompts you for the location to which you want to export your form library data. You can either select the option to use an existing database or create a new database for your exported data. Once you have made your selection, click OK to either select a database to use or to select the name and location for the database to be created.
During the export process, a new table will be created and named based on the view you are working with (the table in the example is named Timesheet:All Forms) and the data from your form library columns will be placed in this table, as shown next.
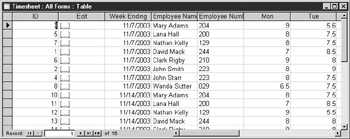
Access automatically adds an ID field as a unique key for your table and another field marked Type that contains the value XML. There is also an Edit field that contains a hyperlink to the underlying form. You can click this link to open the form from SharePoint and then click the Edit in Microsoft InfoPath button to edit the form content.
| Note | Since you are working with a one-off export of the data, you would need to export the data again after you modified the form and saved it back to your form library. |
Once the data has been exported to a table within your Access database, you can use this data as you would with any other Access database, including running queries or reports across the data, exporting to other formats, and so on.
Since this table was exported from your form library and is not tied into any back-end systems, you can edit the table’s structure and design to suit your own use (including deleting the extra Edit and Type columns that were added during the export process).
Linking Form Library Data
Although exporting data to Access may be the simplest method you can use to analyze form library data, what happens when you enter a few more forms and want to analyze the data again? You would need to export the data again and rerun your reports, queries, and so forth. A much easier solution if you need to analyze data periodically is to link an Access table to your form library data. Linked tables are updated automatically and ensure that whenever you run a query or report, you are getting the most current information available.
To link your form library data to an Access table, use the down arrow at the bottom of the task pane to scroll down to the Created Linked Table in Access link. When you click this link, the task pane will change and prompt you for the location where you want to create the linked table. You can either select the option to use an existing database or create a new database for your exported data; once you have made your selection, click OK.
During the linking process, a new table will be created and named based on the view you are working with (for example, Timesheet:All Forms) and this table will be linked to your form library data.
| Tip | A linked table will appear within Access with a small arrow on the left side of the table icon. |
Since the table is linked to your form library data, you won’t need to export the data each time you want to run a query or report. Whenever you open the linked table, the data in the table is read directly from your form library data. And since the table is linked to your form library data, you won’t be able to change the design of the table to add or delete fields.
| Note | If you do need to add additional fields, consider creating another table within Access and then specifying a relationship between the two tables. |
A linked table within Access can be used just like regular tables. You can use this data in your own queries, from simple select queries to complex queries involving multiple tables and other criteria. You will not be able to perform update queries on this table (because the table data is linked directly to your SharePoint form library) but you can use this table for reporting or export the data to other database or spreadsheet formats.
Creating Reports
If you want to take your analysis a step further and create presentation-quality reports from your form library data, you can use the built-in report writer within Access to quickly create reports that you can customize as required.
To create a report from your form library data, use the down arrow at the bottom of the task pane to scroll down to the Report with Access link. When you click this link, the task pane will change and prompt you for the location where you want to create your report. You can either select the option to use an existing database or create a new database for your exported data—once you have made your selection, click OK.
During the report creation process, a new table is created and named based on the view you are working with (for instance, Timesheet:All Forms) and this table will be linked to your form library data. Once the linked table has been established, Access creates a report from the linked data using a columnar style, which places all the fields from your table in a single column in the report, as shown in Figure 12-22.
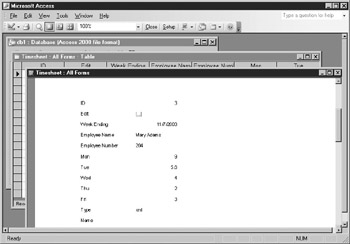
Figure 12-22: A typical report created from form library data
While this may not suit every application, it provides a starting point for your own report design. You can see the design of the report that was created by selecting View | Design View. You can then change the order and position of fields, add grouping, add sorting, and so on, as you would with any other Access report.
| Tip | For more information on creating and modifying reports with Access 2003, check out How to Do Everything with Microsoft Office Access 2003, by Virginia Andersen (McGraw-Hill/Osborne, 2003). |
EAN: 2147483647
Pages: 142