Debugging Code
| C#Builder has a full-featured debugger, which enables you to set breakpoints, step through code, and inspect variables. The default configuration of the IDE is to enable debugging, so the debugging features are ready to go when you begin a project. Listing 5.1 contains a practice program that will help when trying out the debugging features described in this section. Example 5.1 Sample Program for Debugging (AddNumbers.cs) using System; using System.Collections; class AddNumbers { private static ArrayList m_numbers = new ArrayList(); static void Main() { GetInput(); Console.WriteLine(); try { Console.WriteLine("Sum: {0}", CalcSum()); } catch (FormatException fex) { Console.WriteLine(fex.ToString()); Console.WriteLine("\nInvalid Input: "); foreach (string number in m_numbers) { Console.WriteLine(number); } } Console.ReadLine(); } public static void GetInput() { string banner = @" /************************************* * Sum Program * * * * Enter numbers and receive a sum. * **************************************/ "; Console.WriteLine(banner); string input = null; do { Console.Write("Please provide a number or \"q\" to quit: "); input = Console.ReadLine(); input = input.Trim().ToUpper(); if (input != "Q") m_numbers.Add(input); } while (input != "Q"); } public static int CalcSum() { int[] integers = new int[m_numbers.Count]; for (int i=0; i < m_numbers.Count; i++) { integers[i] = Int32.Parse((string)m_numbers[i]); } int total = 0; foreach( int integer in integers) { total += integer; } return total; } } The program in Listing 5.1 prompts a user for a set of numbers and performs a sum of the input. If the input is invalid (not an integer), the program will generate an exception, which is caught and handled in the main method. The features of this program are C# language elements that have already been covered in Chapters 2 through 4. The program can be created by setting up a console program, as discussed in Chapter 1. Stepping Through Code with the DebuggerThe debugger provides several options for navigating code. Table 5.1 lists the options and their purposes.
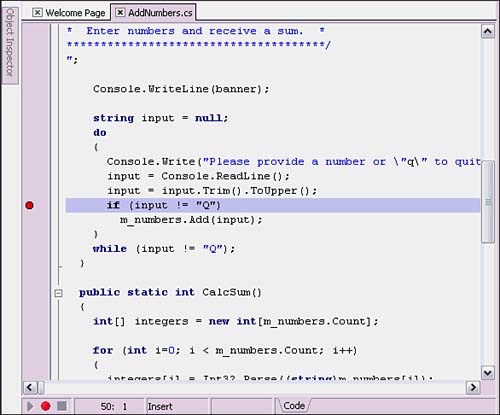
The Step Over (F8) and Trace Into (F7) options are the procedures used most frequently and are very straightforward. Trace to Next Source Line (Shift+F7) helps when you don't want to waste time stepping on syntax items, such as ending routine braces, that don't add to the debugging experience. Run to Cursor (F4) is essential for running through a block of code, such as a loop, that doesn't need to be looked at in close detail. Run Until Return (Shift+F8) saves time by stepping out of a routine when there is no need to examine the rest of that routine's code. To practice these navigation techniques, set a breakpoint on the first line of executable code in the Main method by clicking on the left margin (gutter) and clicking the Run button on the toolbar or pressing F9, which will begin debugging the program. Choosing Run, Program Reset or pressing Ctrl+F2 will stop a debugging session immediately. Working with BreakpointsDebugging would become tedious if the only tools available were those for stepping through code. It's very helpful to allow a program to run until it reaches a certain point or a specific condition is met. This is the purpose of breakpoints. In C#Builder there are two ways to run programs, Run or Run Without Debugging, which are accessible from the Run menu. Each option runs a program a different way. The Run Without Debugging command will execute your program right away. However, the Run (F9) command starts the program in Debugging mode. Pressing F9 will make the program stop on any breakpoints that you set. When no breakpoints are set, the program will run normally without stopping. At the most basic level, working with breakpoints in C#Builder is simply a matter of clicking the left margin on the line where execution should stop (see Figure 5.1). Using the code in Listing 5.1, place a breakpoint on the line if (input != "Q") and press F9 to run in debugging mode. Enter a value when prompted and press Enter. This will hit the breakpoint you just set. Hover the cursor over the word "input", which will display a ToolTip with the current value of input. Breakpoints toggle when you click their left margin, and you can remove the current breakpoint by clicking the red dot in the left margin. Pressing F9 will allow the program to continue. Figure 5.1. Setting a single breakpoint.
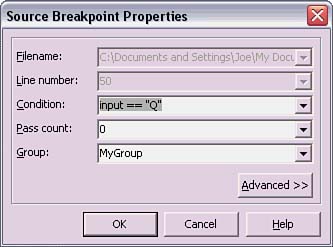
Breakpoint management is very sophisticated, providing grouping and conditional management. Make sure the breakpoint is still set on the line if (input != "Q") in the GetInput method of Listing 5.1. Right-click on the red dot in the left margin of the breakpoint and select Breakpoint Properties. The Source Breakpoint Properties dialog is shown in Figure 5.2. Figure 5.2. The Source Breakpoint Properties dialog.
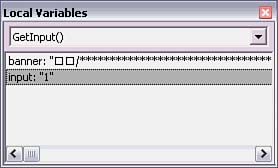
Specifying a condition such as input == "Q" will allow the program to run until the condition is true. This is a huge timesaver because it eliminates stepping through code until the condition is met. The Pass Count setting will cause a breakpoint stop when a certain line has been visited the specified number of times. This would be useful for loops with different types of controls or for specifying a point to stop in an infinite loop error. You can either enter a new group name or select an existing group to which you add this breakpoint. Breakpoints can be categorized into groups, which are enabled or disabled as you need. Choosing View, Debug Windows, Breakpoints (Ctrl+Alt+B) will open the Breakpoint List at the bottom of the window. Its context menu (right-click inside the list) contains Enable Group and Disable Group options for turning breakpoint groups on and off, respectively. The breakpoints in a disabled group don't go away, but C#Builder will not stop on them when debugging. The context menu also contains options for adding, deleting, enabling, and disabling individual breakpoints. When a breakpoint is selected in the Breakpoint List, you have to locate and follow the context menu to the Breakpoints menu item at a second level, but when nothing is selected in the Breakpoint List the options appear on the first-level menu. Selecting a breakpoint in the Breakpoint List and pressing Ctrl+A will bring up the Add Source Breakpoint dialog, which lets you add a new breakpoint. Double-clicking an entry or pressing Ctrl+S when the entry is highlighted will move to the breakpoint in the source code editor. Active breakpoints appear in the Breakpoint List with an icon that has a very small red spot. Disabled breakpoints have a gray spot on their icon. Additionally, disabled breakpoints appear in the source code editor with a grayed-out dot in the left margin. The icon for an invalid breakpoint appears in the Breakpoint List with a red circle. Double-clicking an item in the Breakpoint List will move you to the line in the source code editor where that breakpoint is located. Inspecting and Watching Application StateInspecting program state is the primary purpose of debugging, and C#Builder provides several facilities for making this easy. Earlier in this section, I showed how to get values of local variables by hovering over them with the cursor in the editor. Other program state inspection facilities include the Disassembly, Local Variables, Watch List, Call Stack, Modules, Thread Status, and Event Log windows. These windows are accessible via the Debug Windows menu item of the View menu. Disassembly WindowThe disassembly window, accessible by pressing Ctrl+Alt+C during runtime, shows the machine code that has been generated by the JIT compiler. This window contains advanced functionality that is used by people who understand the native machine code of the computer they are working on. Local Variables WindowThe Local Variables window, which you can open by pressing Ctrl+Alt+L, displays a list of local variables and their values, as shown in Figure 5.3. You don't have to add anything to this window because the local variables appear automatically. This reveals runtime diagnostics of variables that are active at the current debugging location. Figure 5.3. The Local Variables window.
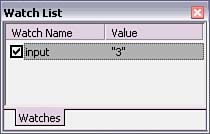
Watch List WindowThe Watch List window (see Figure 5.4) is for keeping a list of specialized variables that will show values only when they are in scope. You can open the Watch List window by pressing Ctrl+Alt+W. It is also possible to add methods and other expressions to the Watch List by pressing Ctrl+F5, drag-and-dropping, or right-clicking in the list to get a context menu and selecting Add Watch. Each item in the Watch List has a check mark that will temporarily disable the watch. Double-clicking an item or pressing Ctrl+E brings up a Watch properties dialog that allows you to customize how the watch appears. Figure 5.4. The Watch List window.
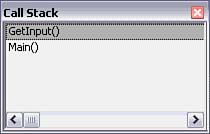
Call Stack WindowThe Call Stack window shows the current call stack (see Figure 5.5). You can open the Call Stack window by pressing Ctrl+Alt+S. Double-clicking an entry in the Call Stack window brings the cursor to the point in the program where the path of execution in that method led to the current breakpoint. Figure 5.5. The Call Stack window.
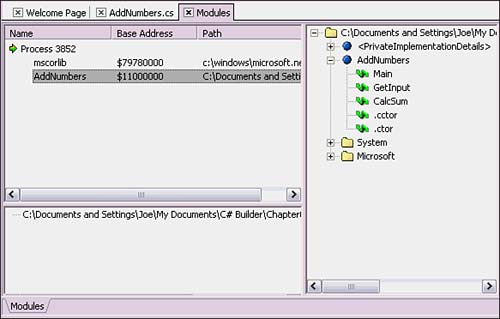
Modules WindowThe Modules window, which you can open by pressing Ctrl+Alt+M, shows the current system process associated with the assemblies loaded into the current running program (see Figure 5.6). Relevant information includes the module name, its base address, and the path it is loaded from. The purpose of this information is so that you can tell whether the program is running with the proper assemblies and how they are loaded. Figure 5.6. The Modules window.
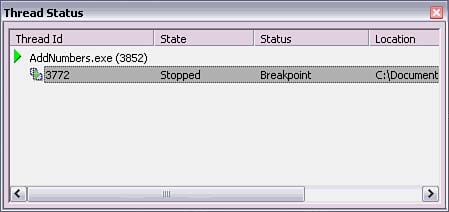
Thread Status WindowWhen you're running multithreaded programs, the Thread Status window, which you can open by pressing Ctrl+Alt+T, shows the point of execution of each thread at the breakpoint (see Figure 5.7). What will happen when you are debugging a multithreaded program is that stepping through a program will jump between threads. The Thread Status window helps you get back to the thread being traced. It is also useful to see which thread is performing a certain action when a breakpoint is hit. Context menu options allow you to either view or move to the source location where the currently selected thread is executing. Figure 5.7. The Thread Status window.
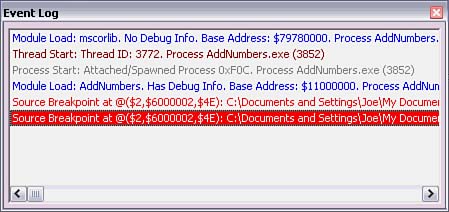
Event Log WindowThe Event Log window, which you can open by pressing Ctrl+Alt+V, captures the ongoing state of a session and can be saved to a file for later analysis (see Figure 5.8). Its context menu includes an option to add custom comments, clear the menu, set properties, and clear the log. Properties include options to control color and set what is entered into the log. Figure 5.8. The Event Log window.
|