Section 12.3. Graphing Other Objects
12.3. Graphing Other ObjectsMRTG polls and graphs the MIB variables ifInOctets and ifOutOctets by default, but it is possible to poll and graph the values of other objects in addition to polling different kinds of devices. First let's get MRTG collecting input and output octets from a server. To do this, run the following command: [root][linuxserver] ~/mrtg-2.10.15> cfgmaker public@127.0.0.1 >> /mrtg2/run/mrtg.cfg This is almost identical to the command we ran earlier in the chapter, except for the community string and target[*] (public@127.0.0.1). We appended the output to the mrtg.cfg file, as opposed to specifying an output file with the output option; this lets us add a new host to the existing configuration file, instead of starting a new file. Because the existing file already specifies a working directory, we also omitted the working directory option (global 'WorkDir: ... ' ). This cfgmaker command adds a number of lines like the following to the configuration file:
Target[127.0.0.1_2]: 2:public@127.0.0.1: SetEnv[127.0.0.1_2]: MRTG_INT_IP="" MRTG_INT_DESCR="eth0" MaxBytes[127.0.0.1_2]: 12500000 Title[127.0.0.1_2]: Traffic Analysis for 2 -- box PageTop[127.0.0.1_2]: <H1>Traffic Analysis for 2 -- box</H1> <TABLE> Figure 12-2. Daily, weekly, monthly, and yearly graphs for Ethernet0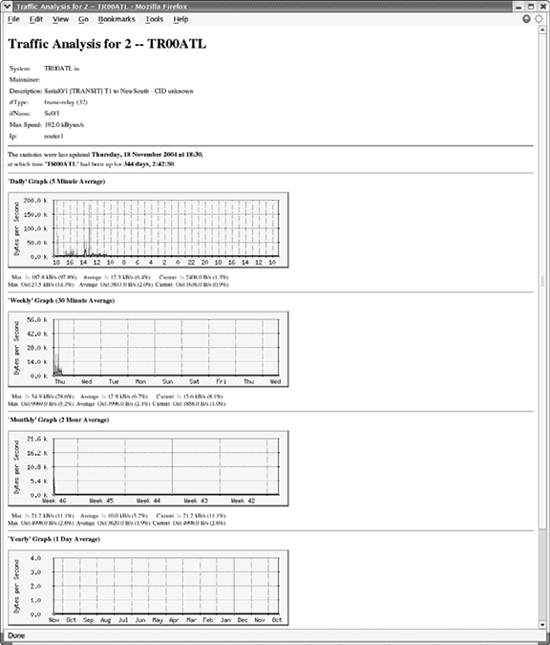 <TR><TD>System:</TD> <TD>box in Atlanta,GA</TD></TR> <TR><TD>Maintainer:</TD> <TD>"kjs@guarded.net"</TD></TR> <TR><TD>Description:</TD><TD>eth0 </TD></TR> <TR><TD>ifType:</TD> <TD>ethernetCsmacd (6)</TD></TR> <TR><TD>ifName:</TD> <TD></TD></TR> <TR><TD>Max Speed:</TD> <TD>12.5 MBytes/s</TD></TR> </TABLE> These lines tell MRTG how to poll the server's Ethernet interface. The key used for this interface is 127.0.0.1, and the target number is 2. Why 2? Remember that cfgmaker walks the interface table to determine what entries to add to the configuration file. Therefore, you'll see a set of lines like this for each interface on the device, including the loopback interface. The target numbers are actually indexes into the interface table; on this server, the loopback interface has the index 1. Now let's create an entry to graph the number of users logged onto the server and the total number of processes running. MRTG is capable of graphing these parameters, but you have to specify explicitly which MIB variables to graph. Furthermore, you have to specify two variablesMRTG won't graph just one. (This is a rather strange limitation, but at least it's consistent: remember that the default graphs show both input and output octets.) First, let's look at the MIB variables we plan to graph. The two variables, hrSystemNumUsers and hrSystemProcesses, are defined as OIDs 1.3.6.1.2.1.25.1.5.6.0 and 1.3.6.1.2.1.25.1.6.0, respectively. The .0 at the end of each OID indicates that these two objects are both scalar variables, not part of a table. Both come from the Host Resources MIB (RFC 2790), which defines a set of managed objects for system administration. (Some agents that run on server systems implement this MIB, but unfortunately, the Microsoft and Solaris agents do not.) The definitions for these objects are: hrSystemNumUsers OBJECT-TYPE SYNTAX Gauge ACCESS read-only STATUS mandatory DESCRIPTION "The number of user sessions for which this host is storing state information. A session is a collection of processes requiring a single act of user authentication and possibly subject to collective job control." ::= { hrSystem 5 } hrSystemProcesses OBJECT-TYPE SYNTAX Gauge ACCESS read-only STATUS mandatory DESCRIPTION "The number of process contexts currently loaded or running on this system." ::= { hrSystem 6 } The entry we added to our configuration file looks like this: Target[127.0.0.1_3]: 1.3.6.1.2.1.25.1.5.0&1.3.6.1.2.1.25.1.6.0:public@localhost MaxBytes[127.0.0.1_3]: 512 Options[127.0.0.1_3]: gauge Title[127.0.0.1_3]: Number of Users and Processes on localhost YLegend[127.0.0.1_3]: Users/Processes LegendI[127.0.0.1_3]: Users: LegendO[127.0.0.1_3]: Processes: PageTop[127.0.0.1_3]: <H1>Number of Users and Processes on localhost</H1> <TABLE> <TR><TD>System:</TD> <TD>box in Atlanta,GA</TD></TR> <TR><TD>Maintainer:</TD> <TD>"kjs@guarded.net"</TD></TR> </TABLE> The first line specifies the device we want MRTG to poll, along with the two OIDs (hrSystemNumUsers and hrSystemProcessess) we want to graph. This statement is obviously more complex than the Target statement we looked at earlier; its syntax is OID1&OID2:community_string@device. The OIDs must be separated by an ampersand character (&). Using this syntax, you can convince MRTG to graph any two scalar-valued MIB variables. In the next line, we set MaxBytes to 512. This is the maximum value for the graph; values greater than 512 are set to 512. (Forget about bytes; MaxBytes simply defines a maximum value.) For the number of users logged in, this is a high number; there should never be this many people logged onto our system at once. The same goes for the total number of processes running on the system. You can choose values that make sense for your particular environment. If you need separate maximum values for each object, replace MaxBytes with two lines setting MaxBytes1 and MaxBytes2. The Options command is a new one; it allows you to change how MRTG treats the data it gathers. The only option we have specified is gauge. This instructs MRTG to treat the gathered data as Gauge data, not Counter data. Recall that Counter data is monotonically increasing while Gauge data is not. Since the MIB definitions for both objects specify the Gauge datatype, this option makes sense. The YLegend, LegendI, and LegendO options are also new. YLegend simply changes the label that is placed on the Y-axis of the graph itself. Since we're graphing the number of users and processes, we set the legend to Users/Processes. It's important for the legend to be short; if it's too long, MRTG silently ignores it and doesn't print anything for the label. LegendI changes the legend used below the graph for the so-called "input variable" (in this case, the number of users logged into the systemremember that MRTG expects to be graphing input and output octets). LegendO changes the legend for the "output variable" (the total number of processes running on the system). The terminology is unfortunate; just remember that MRTG always graphs a pair of objects and that the input legend always refers to the first object and the output legend refers to the second. Once you have added this entry to your configuration file and saved it, MRTG will start gathering data from the device every time it runs. If you have added the appropriate entry in your crontab file, you're all set. Now we'll use indexmaker to create intuitive index files for the server graphs, just as we did for the router graphs. The command to create a new index file is similar to the one we used to create the Cisco index file: [root][linuxserver] ~/mrtg-2.10.15> indexmaker --title "Linux Server" \ --filter name=~'127.0.0.1' --output /mrtg/images/linux.html /mrtg/run/mrtg.cfg Figure 12-3 shows the index page for the server graphs. It contains only two graphs: one shows traffic on the Ethernet interface and the other shows the number of running processes versus the number of users logged onto the system. Figure 12-3. Linux server overview graphs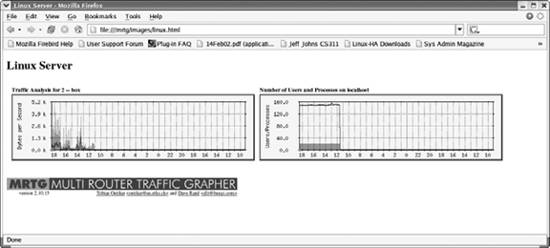 Figure 12-4 shows the daily, weekly, monthly, and yearly graphs for the number of users and processes logged into the system. |
EAN: 2147483647
Pages: 165
- Chapter VIII Personalization Systems and Their Deployment as Web Site Interface Design Decisions
- Chapter X Converting Browsers to Buyers: Key Considerations in Designing Business-to-Consumer Web Sites
- Chapter XI User Satisfaction with Web Portals: An Empirical Study
- Chapter XIV Product Catalog and Shopping Cart Effective Design
- Chapter XVII Internet Markets and E-Loyalty