Nomograph
| It would be nice to be able to do the calculations presented in the illustrative example quickly, and even better to get results without having to plug numbers into equations. Though the relationships are simple, even I must admit that working with equations is not a favorite activity of most managers these days. All is not lost, however. Back in the days of ships of wood and men of iron, there was a simple solution to capturing relationships among variables: graphical methods, in particular, the device known as the nomograph.[5] The user simply laid a straightedge across some specially arranged and calibrated scales. If serial calculations were required, multiple instances of this technique could be chained together, all on one sheet of paper. An engineer did the non-trivial mathematical work behind the nomograph, and a master nomographer produced a chart that was ridiculously simple to use. This technique, documented by d'Ocagne around 1900, was highly developed by the worldwide engineering community from around 1925 to 1975, when the advent of pocket calculators and computers caused it to go out of fashion. A quarter of a century later, as is frequently the case of useful things that fall by the wayside, we await its worthy replacement. In vain, I'm afraid.
I've created such a nomograph for the equations in this chapter. It is displayed as Figure 22.5. As with all good nomographs, a usage example is included right on the chart. Note that this is our illustrative example from earlier. Figure 22.5. Growth and productivity nomograph.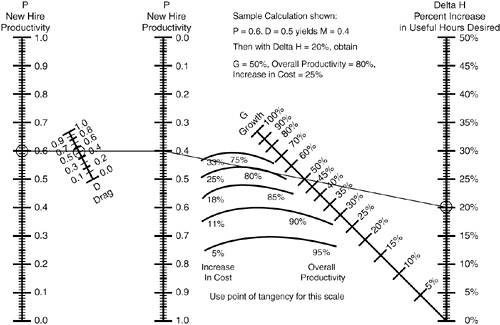 Nomographs have the interesting property of solving equations both explicitly and implicitly. You can find any missing variable or combination of variables by "working backwards." Experiment a little with this. For example, start with an "allowable" increase in cost and percentage increase in useful hours desired to find the growth rate needed and the multiplier this implies. Then see which combinations of P and D give you that M. Often this type of exploration is useful in seeing whether your constraints can be met. Let me explain how I constructed the nomograph. Moving left to right, the first part is done by observing that the relationship between P, D, and M is a standard form that is amenable to a "Z-type" nomograph; the non-linear scale for D is constructed manually by finding appropriate common intersection points. Then the M, Delta H, and G nomograph is added, using the notion that useful hours derive from growth G times the multiplier M. Once again, a slightly different "Z-type" nomograph is appropriate, and the non-linear G scale is determined by the method of intersections. Finally, once we know the Delta H we want and the multiplier M we have already determined, both overall productivity and its inverse, the increase in cost, are determined. These, however, turn out to be envelopes, not simple intersections. These envelopes were constructed graphically by using many pairs of values for Delta H and M corresponding to each value of overall productivity; adding the increase in cost is just a labeling exercise at that point. |
EAN: N/A
Pages: 269