Section 18.4. Traffic Sniffing
18.4. Traffic SniffingCapture, Intercept, Log, Monitor, Network, Record, Sniff, Traffic Figure 18-12. Traffic Sniffing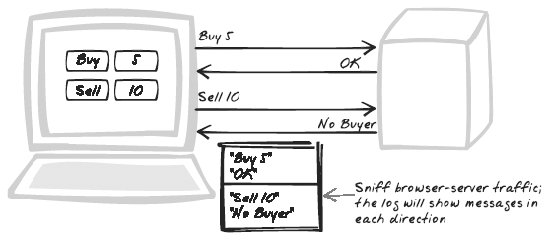 18.4.1. Developer StoryDave hears a report that critical form data isn't being saved on the database. He turns a sniffer on and tries uploading the same data himself. The sniffer shows him an XML message being uploaded via XMLHttpRequest. When inspecting the message in an XML editor, he discovers that the JavaScript hasn't formatted it correctly. 18.4.2. ProblemHow can you diagnose errors and strange behavior? 18.4.3. SolutionDiagnose problems by sniffing Web Remoting traffic. Many Ajax problems arise because Web Remoting (Chapter 6) messages are either wrong or are not sent at all. Debugging (see earlier in this chapter) and general Logging on either side of the network might help you infer what's being transmitted, but it's better to grab the traffic directly. There are various ways to do this:
Traffic Sniffing is a kind of Logging function. As such, you'll probably want similar filtering functionality, e.g., to see messages in only one direction, matching certain text, or to a particular URL. 18.4.4. Tool Support18.4.4.1. XMLHttpRequest Tracing and XMLHttpRequest DebuggingJulien Couvreur has written two invaluable Firefox tools: XMLHttpRequest Tracing (http://blog.monstuff.com/archives/000252.html) unobtrusively logs traffic to the JavaScript console, while XMLHttpRequest Debugging (http://blog.monstuff.com/archives/images/XMLHttpRequestDebugging.v1.0.user.js) is a much more powerful, interactive Popup tool that not only shows the messages but lets you set filters and configure the display (Figure 18-13). Both are Greasemonkey scripts (http://greasemonkey.mozdev.org/), so you'll need to install the Greasemonkey extension first. Figure 18-13. XMLHttpRequest Debugging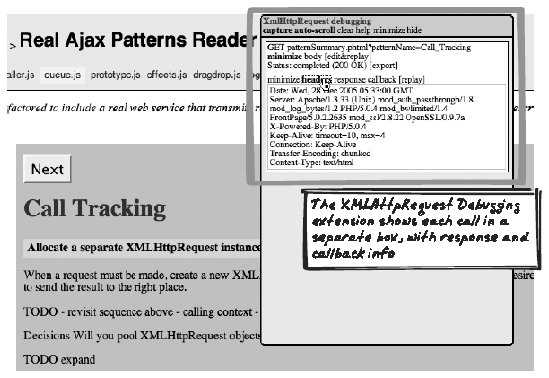 18.4.4.2. FiddlerFiddler (http://www.fiddlertool.com/Fiddler/dev/) is a Windows proxy specifically designed for analyzing and "fiddling" with browser-server traffic (Figure 18-14). Figure 18-14. Fiddler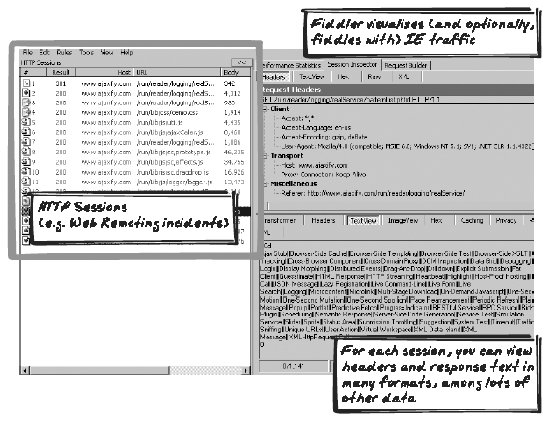 18.4.4.3. FlangeLibAdam Vandenberg has noted that his personal flangelib.js library (http://www.livejournal.com/users/piehead/tag/javascript) contains an XMLHttpRequest wrapper to log traffic. While you're unlikely to use flangelib, it's mentioned here because some XMLHttpRequest wrapper libraries may eventually implement Logging functionality. The main barrier right now is the lack of an industry-standard Logging library. 18.4.5. Code Example: Using XMLHttpRequest TracingFollowing is the output from the XMLHttpRequest tracing script during the initial load sequence for the Ajax Patterns Reader (http://www.ajaxify.com/run/reader/logging/realService/). First, the request is logged in the Firefox JavaScript console: http://blog.monstuff.com/XmlHttpRequestTracing: [736] intercepted open (GET , patternList.phtml , true , undefined , undefined) http://blog.monstuff.com/XmlHttpRequestTracing: [736] intercepted send (null) Then, the result is displayed, showing response code (200) and content: http://blog.monstuff.com/XmlHttpRequestTracing: [736] intercepted load: 200 Ajax Stub|||Browser-Side Cache|||Browser-Side Templating|||Browser-Side XSLT||| .... 18.4.6. Related Patterns18.4.6.1. LoggingTraffic Sniffing in the browser is a form of Logging (see earlier). |