9.1. Understanding Crosstab Queries A crosstab query is a powerful summary tool that examines huge amounts of data and uses it to calculate information like subtotals and averages. If this sounds familiar, it's because you've already seen totals queries do exactly the same thing in Chapter 7. As with totals queries, crosstab queries use two key ingredients : grouping and summary functions. The grouping is used to organize the rows into small sets. The summary function is used to calculate a single piece of information for each group . Behind the scenes, crosstab queries and totals queries work in almost exactly the same way. Both take large numbers of records and boil them down to totals, averages, minimums, maximums, and so on. However, there are two important differences. First, crosstab queries always use two levels of grouping. For example, a typical totals query may group order records by product, so you can see the top sellers and how much cash they bring in. But a crosstab query can analyze sales figures by country and product category. Using this type of analysis, you can quickly see what product categories do well in particular countries . The other difference between totals queries and crosstab queries is the way Access organizes the results. A totals query creates a separate row for each different group. For example, if you're analyzing sales by country and product category, a totals query gives you a row for each country and category combination, as shown in Figure 9-1, top. A crosstab query works a little differently; it takes the same information and packs it into separate columns , creating a denser view (Figure 9-1, bottom). Figure 9-1, bottom, shows you what things look like with two levels of grouping: countries and products. But if you want, your crosstab queries can use more than two levels of grouping. (More levels are helpful when you want to perform really detailed analysisfor example, find out what product categories do well in specific countries, states, and cities.) In this case, the last grouping level is used to split the row into columns. Every other level is used to subdivide your results into more rows. If you create a crosstab query that groups sales by product category, product name , and country, you see the result shown in Figure 9-2.
Note: Remember, if you use more than two levels of grouping, the last level of grouping (the one used to create the columns) shouldn't be related to any other level. However, the other levels can be related . The example in Figure 9-2 works because it follows this rule (grouping by category, product, and then country). The same data grouped differently (for example, category, country, product) doesn't work nearly as well.
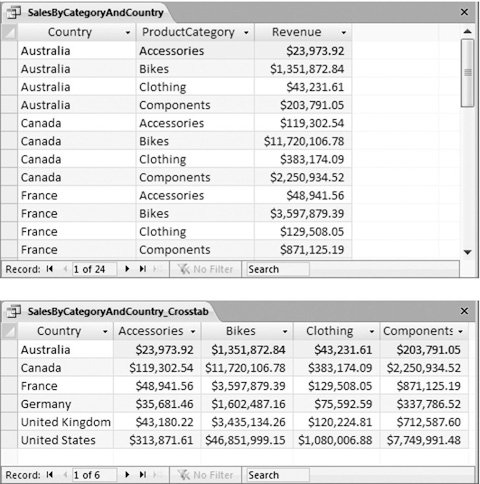 | Figure 9-1. Top: In a totals query, each group resides on a separate row, representing the sales of a single product category in a single country. There are 24 groups in all, and this makes for a long, narrow list of results.
Bottom: In a crosstab query, Access uses the first level of grouping (in this case, the country) to divide the data into rows, and the last level (the product category) to divide each row into columns. The numbers you see are the same as in the top figure, but now you have just six rows, each with four product groups. | |
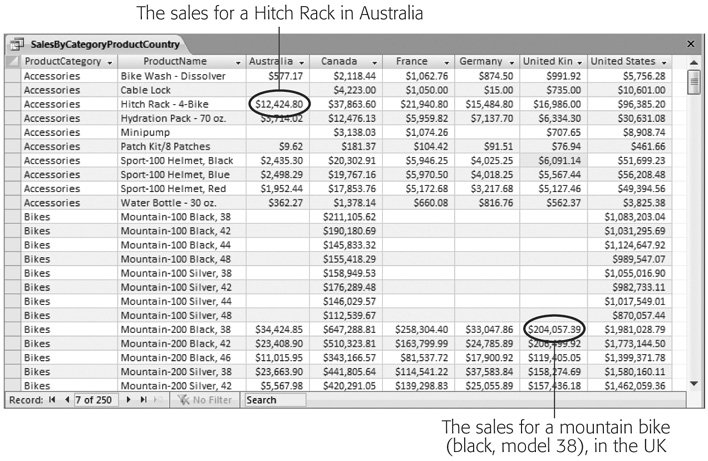 | Figure 9-2. In this example, the records are grouped into rows by product category, and then subdivided by product. The data for each product is then further split into country-specific columns. | |
FREQUENTLY ASKED QUESTION
Summary Smackdown: Totals Query vs. Crosstab Query | | Which is better: the totals query or the crosstab query? It all depends on the type of information you want to analyze, and how it's structured. Here are some guidelines to help you decide which option is right for your data: -
If you want to group according to one field only (as shown, for example, in Figure 9-1, top), use a totals query . Crosstab queries always have at least two levels of grouping. -
If you want to perform more than one type of calculation (for example, averages and totals, or minimums and maximums), use a totals query . Because of their compact format, crosstab queries can show only a single calculated value for each group. Totals queries can show as many calculated values as you want, because each one is placed in a separate column. -
If you want to compare one group against another, use a crosstab query . This is where crosstab queries really shine . They put subgroups on a single row so you can see trends at a single glance. To see an example, look at Figure 9-1. In the crosstab query, it is easy to spot that accessories bring in the least amount of money, no matter what country you are looking at. In the totals query, your eyes need to jump back and forth between different categories and countries to make the same comparison. -
If your grouping criteria results in a large number of groups, consider using a totals query . A crosstab query can be hard to read if it has too many columns. (Another option is to use filtering [Section 6.2.1.1] to cut down the number of different groups.) -
If you're using two unrelated levels of grouping, consider the crosstab query . For example, product category and customer country are two totally separate criteria. You have no way to know whether some countries favor certain categories until you dig into the numbers. This type of organization is an ideal candidate for the dense grid of the crosstab query. On the other hand, product category and product name are related. Every product falls into a set category, and no product turns up in more than one category. If you use this type of grouping in a crosstab query, you wind up with a lot of wasted space, as you can see in Figure 9-3. In many cases, you may want to try both approachescreating a totals query and a crosstab queryand then compare them to see which representation you prefer. |
|