Lesson 6: Active Directory Performance Monitoring Tools
Monitoring Active Directory performance is an important part of maintaining and administering your Microsoft Windows 2000 installation. You use Active Directory performance data to
- Understand Active Directory performance and the corresponding effect on your system's resources
- Observe changes and trends in performance and resource usage so you can plan for future upgrades
- Test configuration changes or other tuning efforts by monitoring the results
- Diagnose problems and target components or processes for optimization
This lesson introduces you to the Active Directory performance monitoring tools and guides you through the steps required to set up Active Directory performance monitoring.
After this lesson, you will be able to
- Describe the purpose of the Event Viewer console
- Use the Event Viewer console to view event logs
- Describe the components of the Performance console
- Describe the purpose of the System Monitor
- Use the System Monitor to monitor performance counters
- Describe the purpose of counter logs, trace logs, and alerts
- Use Performance Logs and Alerts to create counter logs, trace logs, and alerts
Estimated lesson time: 50 minutes
Performance Monitoring Tools
Windows 2000 provides several tools for monitoring Active Directory performance. On the Administrative Tools menu, the Event Viewer console allows you to view log files and error messages sent by applications. The Performance console provides a graphical way to view performance of Active Directory according to measurements, or counters, that you select. The Performance console also provides a means to log activity or send alerts according to those measurements and view the logs either printed or online.
The Event Viewer Console
Windows 2000 provides the Event Viewer console as a way to monitor Windows-wide events such as application, system, and security events, and service-specific events such as directory service events. These events are recorded in event logs. For example, if you need detailed information about when directory partitions are being replicated, you would study the File Replication Service log in the Event Viewer.
Also, if you experience problems with Active Directory, it is recommended that the directory service event logs be the first item that you use to investigate the causes of the problem. By using information from the event log, you can better understand the sequence and types of events that led up to a particular performance problem.
Event Viewer can be used to view, locate, filter, and archive information contained in Windows 2000 security logs and to configure security logs. The procedures for each of these tasks are similar for the event logs used to monitor Active Directory performance. These logs are described in Table 19.5.
Table 19.5 Event Logs for Monitoring Active Directory Performance
| Log | Description |
|---|---|
| Application | Contains errors, warnings, or information generated by applications, such as a database server or an e-mail program. The application developer presets which events to record. |
| Directory Service | Contains errors, warnings, and information generated by Active Directory (see Figure 19.8). |
| File Replication Service | Contains errors, warnings, and information generated by the File Replication service. |
| System | Contains errors, warnings, and information generated by Windows 2000. Windows 2000 presets which events to record. |
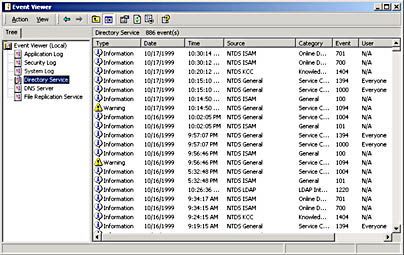
Figure 19.8 The Directory Service log
The Performance Console
The Performance console allows you to monitor conditions within local and remote computers anywhere in your network and to summarize performance at selected intervals. The Performance console can use various counters for monitoring real-time resource usage. It can log results into a file so that you can view and diagnose historical performance problems. With appropriate permissions, it can monitor resource usage of other computers that run server services on the network. The Performance console can also be used for collecting baseline performance data and then configured to send alerts to the Event Log or other locations about exceptions to the baseline.
The Performance console contains two snap-ins: System Monitor (an ActiveX control) and Performance Logs And Alerts.
System Monitor
With System Monitor, you can measure Active Directory performance on your own computer or other computers on a network. You can perform the following tasks:
- Collect and view real-time performance data on a local computer or from several remote computers
- View data collected either currently or previously recorded in a counter log
- Present data in a printable graph, histogram, or report view
- Incorporate System Monitor functionality into Microsoft Word or other applications in the Microsoft Office suite by means of Automation
- Create Hypertext Markup Language (HTML) pages from performance views
- Create reusable monitoring configurations that can be installed on other computers using the Microsoft Management Console (MMC)
A sample System Monitor is shown in Figure 19.9.
You can define the Active Directory data you want to collect in the following ways:
- Type of data. To select the data to be collected, you specify performance objects and performance counters.
- Source of data. System Monitor can collect data from your local computer or from other computers on the network where you have permission. (By default, administrative permission associated with the task is required.) In addition, you can include real-time data or data collected previously using counter logs.
- Sampling parameters. System Monitor supports manual, on-demand sampling or automatic sampling based on a time interval you specify. When viewing logged data, you can also choose starting and stopping times so that you can view data spanning a specific time range.
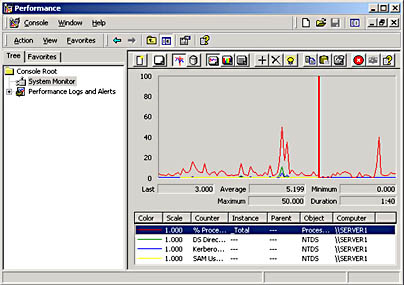
Figure 19.9 A sample System Monitor
In addition to options for defining data content, you have considerable flexibility in designing the appearance of your System Monitor views:
- Type of display. System Monitor supports chart, histogram, and report views.
- Display characteristics. For any of the three display types, you can define the characteristics, colors, and fonts for the display.
Defining Data for Monitoring
To begin monitoring data, you specify performance objects and performance counters. A performance object is a logical connection of counters that is associated with a resource or service that can be monitored. For the purposes of monitoring Active Directory, you monitor the activity of the NTDS (NT Directory Service) performance object. By using System Monitor, you can track the activity of performance objects through the use of counters. Performance counters refer to the multitude of conditions that can apply to a performance object. For example, if you need to find out the number of connected LDAP client sessions, you can select the LDAP Client Sessions counter under the NTDS performance object and then view the current activity by using System Monitor.
The NTDS Performance Object Counters
The NTDS performance object contains many performance counters that provide statistics about Active Directory performance. After determining the statistics you want to monitor, you must find the matching performance counters.
Performance counters can provide some baseline analysis information for capacity and performance planning. Typically, counters that are suited for capacity planning contain the word "total" in their name. These counters fall into three types: statistic counters, ratio counters, and accumulative counters. Statistic counters show totals per second. An example is DRA (Directory Replication Agent) Inbound Properties Total/Sec, which is the total number of object properties received from inbound replication partners. Ratio counters show percentage of total. An example is DS (Directory Service) % Writes From LDAP, which is the percentage of directory writes coming from LDAP query. Accumulative counters show totals since Active Directory was last started. An example is DRA Inbound Bytes Total Since Boot, which is the total number of bytes replicated in, the sum of the number of uncompressed bytes (never compressed) and the number of compressed bytes (after compression).
Each counter has its own guidelines and limits. The counters in Table 19.6 are of special interest for the reasons described.
Table 19.6 Important Active Directory System Monitor Counters on the NTDS Performance Object
| Counter | Description |
|---|---|
| DRA Inbound Bytes Compressed (Between Sites, After Compression)/Sec | The compressed size (in bytes) of inbound compressed replication data (size after compression, from Directory System Agents [DSAs] in other sites). |
| DRA Inbound Bytes Compressed (Between Sites, Before Compression)/Sec | The original size (in bytes) of inbound compressed replication data (size before compression, from DSAs in other sites). |
| DRA Inbound Bytes Not Compressed (Within Site)/Sec | The number of bytes received through inbound replication that were not compressed at the source— that is, from other DSAs in the same site. |
| DRA Inbound Bytes Total/Sec | The total number of bytes received through replication, per second. It is the sum of the number of uncompressed bytes (never compressed) and the number of com- pressed bytes (after compression). |
| DRA Inbound Full Sync Objects Remaining | The number of objects remaining until the full synchronization process is completed, or set. |
| DRA Inbound Objects/Sec | The number of objects received, per second, from replication partners through inbound replication. |
| DRA Inbound Objects Applied/Sec | The rate, per second, at which replication updates are received from replication partners and applied by the local directory service. This count excludes changes that are received but not applied (for example, when the change is already present). This indicates how much replication update activity is occurring on the server as a result of changes generated on other servers. |
| DRA Inbound Objects Filtered/Sec | The number of objects received per second from inbound replication partners that contained no updates that needed to be applied. |
| DRA Inbound Object Updates Remaining in Packet | The number of object updates received in the current directory replication update packet that have not yet been applied to the local server. This tells you whether the monitored server is receiving changes but taking a long time applying them to the database. |
| DRA Inbound Properties Applied/Sec | The number of properties that are applied through inbound replication as a result of reconciliation logic. |
| DRA Inbound Properties Filtered/Sec | The number of property changes that are already known received during the replication. |
| DRA Inbound Properties Total/Sec | The total number of object properties received per second from inbound replication partners. |
| DRA Inbound Values (DNs Only)/Sec | The number of object property values received from inbound replication partners that are Distinguished Names (DNs), per second. This includes objects that reference other objects. Distinguished Names values, such as group or distribution list memberships, are more expensive to apply than other kinds of values because group or distribution list objects can include hundreds and thousands of members and therefore are much bigger than a simple object with only one or two attributes. This counter might explain why inbound changes are slow to be applied to the database. |
| DRA Inbound Values Total/Sec | The total number of object property values received from inbound replication partners per second. Each inbound object has one or more properties, and each property has zero or more values. Zero values indicate property removal. |
| DRA Outbound Bytes Compressed (Between Sites, After Compression)/Sec | The compressed size (in bytes) of outbound compressed replication data, after compression, from DSAs in other sites. |
| DRA Outbound Bytes Compressed (Between Sites, Before Compression)/Sec | The original size (in bytes) of outbound compressed replication data, before compression, from DSAs in other sites. |
| DRA Outbound Bytes Not Compressed (Within Site)/Sec | The number of bytes replicated out that were not compressed, that is, from DSAs in the same site. |
| DRA Outbound Bytes Total/Sec | The total number of bytes replicated out per second. The sum of the number of uncompressed bytes (never compressed) and the number of compressed bytes (after compression). |
| DRA Outbound Objects/Sec | The number of objects replicated out per second. |
| DRA Outbound Objects Filtered/Sec | The number of objects acknowledged by outbound replication that required no updates. They also represent objects that the outbound partner did not already have. |
| DRA Outbound Properties/Sec | The number of properties replicated out per second. This tells you whether a source server is returning objects or not. |
| DRA Outbound Values (DNs Only)/Sec | The number of object property values containing DNs sent to outbound replication partners. DN values, such as group or distribution list memberships, are more expensive to read than other kinds of values because group or distribution list objects can include hundreds and thousands of members and therefore are much bigger than a simple object with only one or two attributes. |
| DRA Outbound Values Total/Sec | The number of object property values sent to outbound replication partners per second. |
| DRA Pending Replication Synchronizations | The number of directory synchronizations that are queued for this server but not yet processed. This helps in determining replication backlog; the larger the number, the larger the backlog. |
| DRA Sync Requests Made | The number of synchronization requests made to replication partners. |
| DS Directory Reads/Sec | The number of directory reads per second. |
| DS Directory Writes/Sec | The number of directory writes per second. |
| DS Security Descriptor Suboperations/Sec | The number of Security Descriptor Propagation sub-operations per second. One Security Descriptor Propagation operation is made up of many suboperations. A suboperation roughly corresponds to an object the propagation causes the propagator to examine. |
| DS Security Descriptor Propagations Events | The number of Security Descriptor Propagation events that are queued but not yet processed. |
| DS Threads in Use | The current number of threads in use by the directory service (different than the number of threads in the directory service process). Threads in Use is the number of threads currently servicing client application programming interface (API) calls and can be used to indicate whether additional processors can be of benefit. |
| Kerberos Authentications/Sec | The number of times per second that clients use a ticket to this domain controller to authenticate this domain controller. |
| LDAP Bind Time | The time (in milliseconds) taken for the last successful LDAP binding. |
| LDAP Client Sessions LDAP Searches/Sec | The number of connected LDAP client sessions. The number of search operations per second performed by LDAP clients. |
| LDAP Successful Binds/Sec | The number of successful LDAP binds per second. |
| NTLM Authentications | The number of NT LAN Manager (NTLM) authentications per second serviced by this domain controller. |
| XDS Client Sessions | The number of connected Extended Directory Service (XDS) client sessions. This indicates the number of connections from other Windows NT services and the Windows NT Administrator program. |
Monitoring Performance Counters
You can select the performance counters to monitor and then view them graphically in the System Monitor as a chart, histogram, or log file data display.
Follow these steps to monitor Active Directory performance counters:
- From the Start menu, select Programs, point to Administrative Tools, and then click Performance.
- Right-click the System Monitor details pane and click Add Counters.
- In the Add Counters dialog box (see Figure 19.10):
- To monitor any computer on which the monitoring console is run, click Use Local Computer Counters.
- To monitor a specific computer, regardless of where the monitoring console is run, click Select Counters From Computer and select a computer name from the list (the name of the local computer is selected by default).
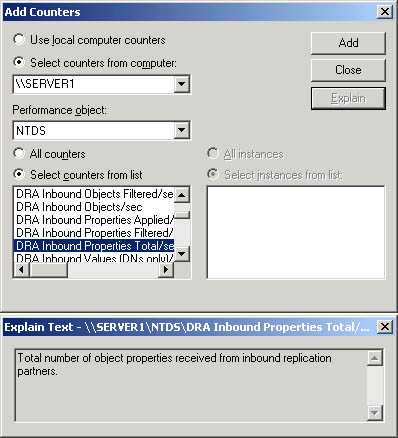
Figure 19.10 The Add Counters dialog box
- In the Performance Object list, select the NTDS performance object.
NOTE
For a description of a particular counter (see Figure 19.10), click the name of the counter from the list, and then click Explain.
- Select the counters to monitor.
- To monitor all counters for the NTDS performance object, click All Counters.
NOTE
Because there are many counters, monitoring all counters affects processing time and is not a practical solution.
- To monitor only selected counters, click Select Counters From List and select the counters you want to monitor. You can select multiple counters by clicking on a counter and holding the Ctrl key.
- Click Add.
- When you are finished adding counters, click Close.
The counters that you selected appear in the lower part of the screen; each counter is represented by its own color. Choose either the chart, histogram, or report display view by clicking the appropriate toolbar button.
NOTE
When creating a System Monitor snap-in for export, make sure to select Use Local Computer Counters on the Select Counters dialog box. Otherwise, System Monitor obtains data from the computer named in the text box, regardless of where the snap-in is installed.
Performance Logs and Alerts
The Performance Logs And Alerts snap-in enables you to create counter logs, trace logs, and system alerts automatically from local or remote computers.
Counter Logs
Counter logs, which are similar to System Monitor, support the definition of performance objects and performance counters and setting sampling intervals for monitoring data about hardware resources and system services. Counter logs collect performance counter data in a comma-separated or tab-separated format for easy import to spreadsheet or database programs. You can view logged counter data using System Monitor or export the data to a file for analysis and report generation.
Trace Logs
Using the default system data provider or another nonsystem provider, trace logs record data when certain activities such as a disk I/O operation or a page fault occur. When the event occurs, the provider sends the data to the Performance Logs and Alerts service. This differs from the operation of counter logs; when counter logs are in use, the service obtains data from the system when the update interval has elapsed, rather than waiting for a specific event.
Active Directory nonsystem providers include those for NetLogon, the Kerberos protocol, SAM, and Windows NT Active Directory Service. These providers generate trace log files containing messages that may be used to track the operations performed.
A parsing tool is required to interpret the trace log output. Developers can create such a tool using APIs provided on the Microsoft Developer Web site (http://msdn.microsoft.com/).
Logging Options
For both counter and trace logs you can
- Define start and stop times, filenames, file types, file sizes, and other parameters for automatic log generation and manage multiple logging sessions from a single console window.
- Start and stop logging either manually on demand or automatically based on a user-defined schedule.
- Configure additional settings for automatic logging, such as automatic file renaming, and set parameters for stopping and starting a log based on the elapsed time or the file size.
- Define a program that runs when a log is stopped.
- View logs during collection as well as after collection has stopped. Because logging runs as a service, data collection occurs regardless of whether any user is logged on to the computer being monitored.
Counter and Trace Logging Requirements
To create or modify a log, you must have Full Control permission for the following registry key, which controls the Performance Logs and Alerts service:
HKEY_LOCAL_MACHINE\SYSTEM\CurrentControlSet\Services\SysmonLog\Log Queries
Administrators usually have this permission by default. Administrators can grant permission to users by using the Security menu in REGEDT32.EXE.
To run the Performance Logs and Alerts service (which runs in the background when you configure a log), you must have permission to start or otherwise configure services on the system. Administrators have this right by default and can grant it to users by using group policy. To log data on a remote computer, the Performance Logs and Alerts service must run under an account that has access to the remote system.
Creating a Counter Log
To create a counter log, you first define the counters you want to log and then set log file and scheduling parameters.
Follow these steps to create a counter log:
- From the Start menu, select Programs, point to Administrative Tools, and then click Performance.
- Double-click Performance Logs And Alerts, and then click Counter Logs.
Any existing logs will be listed in the details pane. A green icon indicates that a log is running; a red icon indicates that a log has been stopped.
- Right-click a blank area of the details pane, and then click New Log Settings.
- In the New Log Settings dialog box, in the Name box, type the name of the log, and then click OK.
- In the General tab of the counter log's dialog box, type the name of the path and filename of the log file in the Current Log File Name box, and then click Add.
- In the Select Counters dialog box, choose the computer for which you want to log counters.
- To log counters from the computer on which the Performance Logs and Alerts service will run, click Use Local Computer Counters.
- To log counters from a specific computer regardless of where the service is run, click Select Counters From Computer and select the name of the computer you want to monitor from the list.
- In the Performance Object list, select an object to log.
- Select the counters you want to log from the list, and then click Add.
- Click Close when you have finished selecting counters to log.
- In the Log Files tab of the counter log's dialog box, configure the options shown in Figure 19.11 and described in Table 19.7.
Table 19.7 Options on the Log Files Tab
| Option | Description |
|---|---|
| Location | The name of the folder where you want the log file created, or click Browse to search for the folder. |
| File Name | A partial or base name for the log file. You can use File Name in conjunction with End File Names With if appropriate. Appears on the details pane. |
| End File Names With | The suffix style you want from the list. Distinguish between individual log files with the same log filename that are in a group of logs that have been automatically generated. |
| Start Numbering At | The start number for automatic file numbering, when you select nnnnnn as the End File Names With. |
| Log File Type | The format you want for this log file. Text File—CSV, defines a comma-delimited log file (with a .csv extension). Use this format to export the log data to a spreadsheet program. Text File—TSV defines a tab-delimited log file (with a .tsv extension). Use this format to export the log data to a spreadsheet program. Binary File defines a sequential, binary-format log file (with a .blg extension). Use this file format if you want to be able to record data instances that are intermittent—that is, stopping and resuming after the log has begun running. Nonbinary file formats cannot accommodate instances that are not persistent throughout the duration of the log. Binary Circular File defines a circular, binary-format log file (with a .blg extension). Use this file format to record data continuously to the same log file, overwriting previous records with new data. |
| Comment | A comment or description for the log file. Appears in the details pane. |
| Log File Size | Maximum Limit - data is continuously collected in a log file until it reaches limits set by disk quotas or the operating system. Limit Of - the maximum size (in kilobytes, up to two gigabytes) of the log file. Select this option if you want to do circular logging. |
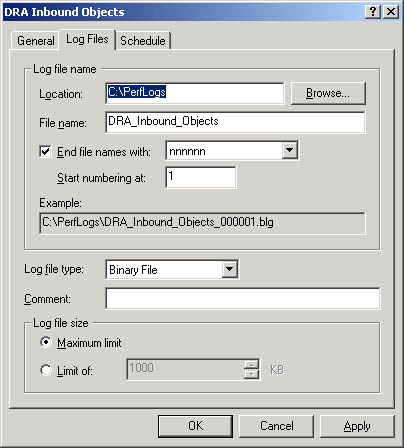
Figure 19.11 The Log Files tab of a counter log's dialog box
- In the Schedule tab of the counter log's dialog box, configure the options shown in Figure 19.12 and described in Table 19.8.
Table 19.8 Options on the Schedule Tab
| Option | Description |
|---|---|
| Start Log | Manually - logging starts manually. At - logging starts according to the time and date parameters you set. |
| Stop Log | Manually - logging stops manually. After - logging stops after the time you specify. At - logging stops at the time and date parameters you set. When The Log File Is Full - logging stops when the log file reaches a maximum size. |
| When A Log File Closes | Start A New Log File - logging resumes in a new file after logging stops for the current log file. Run This Command - a command you specify is run when a log file closes. |
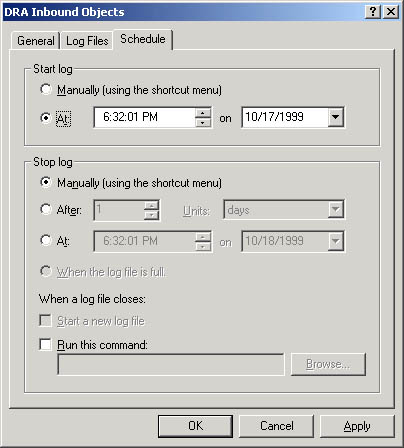
Figure 19.12 The Schedule tab of a counter log's dialog box
- Click OK.
NOTE
When creating a Performance Logs and Alerts snap-in for export, make sure to select Use Local Computer Counters on the Select Counters dialog box. Otherwise, counter logs will obtain data from the computer named in the text box, regardless of where the snap-in is installed.
Creating a Trace Log
To create a trace log, you first define how you want events logged and then set log file and scheduling parameters.
Follow these steps to create a trace log:
- From the Start menu, select Programs, point to Administrative Tools, and then click Performance.
- Double-click Performance Logs And Alerts, and then click Trace Logs.
Any existing logs will be listed in the details pane. A green icon indicates that a log is running; a red icon indicates that a log has been stopped.
- Right-click a blank area of the details pane, and then click New Log Settings.
- In the New Log Settings dialog box, in the Name box, type the name of the log, and then click OK.
In the General tab of the trace log's Properties dialog box, the name of the path and filename of the log file is shown in the Current Log File Name box. By default, the log file is created in the PerfLogs folder in the root directory, and a sequence number is appended to the filename you entered and the sequential trace file type with the .etl extension.
- Select which events you want logged.
- Select Events Logged By System Provider for the default provider (the Windows kernel trace provider) to monitor processes, threads, and other activity. To define events for logging, click the check boxes as appropriate. This can create some performance overhead for the system.
- Select Nonsystem Providers to select the trace data providers you want—for example, if you have written your own providers. Use the Add or Remove buttons to select or remove nonsystem providers.
For a list of the installed providers and their status (enabled or not), click Provider Status.
NOTE
You can have only one trace log that uses the system provider running at a time. In addition, you cannot concurrently run multiple trace logs from the same nonsystem provider. If the system trace provider is enabled, nonsystem providers cannot be enabled, and vice versa. However, you can enable multiple nonsystem providers simultaneously.
- In the Log Files tab of the trace log's Properties dialog box, configure the options as you do for counter logs, except for the options shown in Table 19.9.
Table 19.9 Trace Log-Specific Options in the Log Files Tab
| Option | Description |
|---|---|
| Log File Type | The format you want for this log file: Circular Trace File - defines a circular trace log file (with an .etl extension). Use this file format to record data continuously to the same log file, overwriting previous records with new data. Sequential Trace File defines a sequential trace log file (with an .etl extension) that collects data until it reaches a user-defined limit and then closes and starts a new file. |
| Log File Size | Maximum Limit - data is continuously collected in a log file until it reaches limits set by disk quotas or the operating system. Limit Of - the maximum size (in megabytes) of the log file. Select this option if you want to do circular logging. |
- In the Schedule tab of the trace log's Properties dialog box, configure the options as shown for counter logs.
- Click OK.
NOTE
Trace logging of file details and page faults can generate an extremely large amount of data. It is recommended that you limit trace logging using the file details and page fault options to a maximum of 2 hours.
Alerts
Alerts, which are similar to System Monitor and counter logs, support the use of performance objects and performance counters and setting sampling intervals for monitoring data about hardware resources and system services. Using this data, you can create an alert for a counter, which logs an entry in the application event log, sends a network message to a computer, starts a performance data log, or runs a program when the selected counter's value exceeds or falls below a specified setting.
You can start or stop an alert scan either manually on demand or automatically based on a user-defined schedule.
Creating an Alert
To create an alert, you first define the counters you want to monitor for the alert and then set alert triggering and scheduling parameters.
Follow these steps to create an alert:
- From the Start menu, select Programs, point to Administrative Tools, and then click Performance.
- Double-click Performance Logs And Alerts, and then click Alerts.
Any existing alerts will be listed in the details pane. A green icon indicates that the alerts are running; a red icon indicates alerts have been stopped.
- Right-click a blank area of the details pane and click New Alert Settings.
- In the New Alert Settings dialog box, in the Name box, type the name of the alert, and then click OK.
- In the Comment box on the alert's dialog box, type a comment to describe the alert as needed, and then click Add.
- In the Select Counters dialog box, choose the computer for which you want to create an alert.
- To create an alert on the computer on which the Performance Logs and Alerts service will run, click Use Local Computer Counters.
- To create an alert on a specific computer regardless of where the service is run, click Select Counters From Computer and specify the name of the computer.
- In the Performance Object list, select an object to monitor.
- Select the counters you want to monitor, and then click Add.
- Click Close when you have finished selecting counters to monitor for the alert.
- In the Alert When The Value Is list, specify Under or Over, and in the Limit box, specify the value that triggers the alert.
- In the Sample Data Every section, specify the amount and the unit of measure for the update interval.
- In the Action tab of the alert's dialog box, select when an alert is triggered as shown in Figure 19.13 and described in the following table.
Options on the Action Tab
| Option | Description |
|---|---|
| Log An Entry In The Application Event Log | Creates an entry visible in Event Viewer |
| Send A Network Message To | Triggers the messenger service to send a message to the specified computer |
| Start Performance Data Log | Runs a specified counter log when an alert occurs |
| Run This Program | Triggers the service to create a process and run a specified program when an alert occurs |
| Command Line Arguments | Triggers the service to copy specified command-line arguments when the Run This Program option is used |
- In the Schedule tab of the alert's dialog box, configure the options as shown for counter logs.
- Click OK.
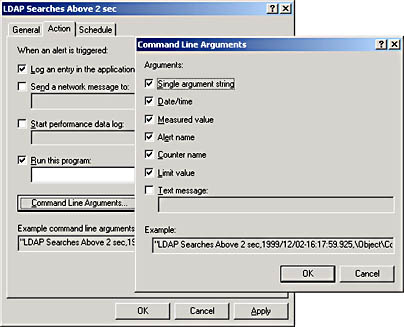
Figure 19.13 The Action tab of an alert's dialog box and the Command Line Arguments dialog box

Practice: Using System Monitor
In this practice, you monitor specified performance counters using System Monitor. Then you use Performance Logs and Alerts to create a counter log and an alert for the LDAP Searches/Sec counter.
Exercise 1: Monitoring Performance Counters
In this exercise, you select performance counters to monitor and then view them graphically in the System Monitor as a chart, histogram, or log file data display.
- From the Start menu, select Programs, point to Administrative Tools, and then click Performance.
- In the console tree, click System Monitor.
- Right-click the System Monitor details pane and click Add Counters.
- Click Select Counters From Computer and ensure that the name of the local computer is selected.
- In the Performance Object list, select the NTDS performance object.
- Click Select Counters From List and select the DRA Pending Replication Synchronizations counter to monitor, and then click Add.
- Select the LDAP Searches/Sec counter to monitor, and then click Add.
- Click Close.
The counters that you selected appear in the lower part of the screen; each counter is represented by its own color. Choose either the chart, histogram, or report display view by clicking the appropriate toolbar button.
Exercise 2: Creating a Counter Log
In this exercise, you create a counter log by first defining the counters you want to log and then setting log file and scheduling parameters.
- From the Start menu, select Programs, point to Administrative Tools, and then click Performance.
- Double-click Performance Logs And Alerts, and then click Counter Logs.
- Right-click a blank area of the details pane, and then click New Log Settings.
- In the New Log Settings dialog box, in the Name box, type LDAP Searches Per Sec and click OK.
- In the General tab of the LDAP Searches Per Sec dialog box, ensure that the default name of the path and filename of the log file in the Current Log File Name box is showing, and then click Add.
- In the Select Counters dialog box, click Select Counters From Computer and ensure that the name of the local computer is selected.
- In the Performance Object list, select the NTDS performance object to log.
- Select the LDAP Searches/Sec counter to log, click Add, and then click Close.
- In the Log Files tab, set the following options:
- Location: C:\PerfLogs (where C:\ is the name of your system drive)
- File Name: LDAP_Searches_Per_Sec
- End File Names With: nnnnnn
- Start Numbering At: 1
- Log File Type: Text File—CSV
- Log File Size: Maximum Limit
- In the Schedule tab, set the following options:
- Start Log At: a time 3 minutes from now
- Stop Log After: 2 minutes
- Click OK.
- When the log starts in 3 minutes, open Active Directory Users And Computers, open and close various OUs and objects, and then close Active Directory Users And Computers.
- When the log has stopped, you can view the contents of the counter log by opening the file \PERFLOGS\LDAP_SEARCHES_PER_SEC_000001.CSV using a spreadsheet program such as Microsoft Excel.
Exercise 3: Creating an Alert
In this exercise, you create an alert by first defining the counters you want to monitor for the alert and then setting alert triggering and scheduling parameters.
- From the Start menu, select Programs, point to Administrative Tools, and then click Performance.
- Double-click Performance Logs And Alerts, and then click Alerts.
- Right-click a blank area of the details pane and click New Alert Settings.
- In the New Alert Settings dialog box, in the Name box, type LDAP Searches Above 5 Sec and click OK.
- In the Comment box on the alert's dialog box, type Alerts when LDAP Searches are more than 5 per second and click Add.
- In the Select Counters dialog box, click Select Counters From Computer and ensure that the name of the local computer is selected.
- In the Performance Object list, click the NTDS performance object to monitor.
- Select the LDAP Searches/Sec counter to monitor, click Add, and then click Close.
- In the Alert When The Value Is box, specify Over, and in Limit, specify 5.
- In the Sample Data Every section, specify the interval of 3 seconds.
- In the Action tab, select the Log An Entry In The Application Event Log check box.
- In the Schedule tab, set the following options:
- Start Scan At: a time 3 minutes from now
- Stop Scan After: 2 minutes
- Click OK.
- When the log starts in 3 minutes, open Active Directory Users And Computers, open and close various OUs and objects, and then close Active Directory Users And Computers.
- When the log has stopped, you can view the alerts in the Application Log in Event Viewer. View the alert information by double-clicking the log entries.
Lesson Summary
In this lesson, you learned about the Active Directory performance monitoring tools, the Event Viewer console, and the Performance console.
The Event Viewer console is a tool to monitor events such as application or system errors or the successful starting of a service. If you experience problems with Active Directory, it is recommended that the directory service event logs be the first item that you use to investigate the causes of the problem.
The Performance console allows you to monitor conditions within local and remote computers anywhere in your network and to summarize performance at selected intervals. The Performance console contains two snap-ins: System Monitor (an ActiveX control) and Performance Logs And Alerts. With System Monitor, you can measure Active Directory performance on your own computer or other computers on a network. The Performance Logs And Alerts snap-in enables you to create counter logs, trace logs, and system alerts automatically from local or remote computers.
In the practice portion of this lesson, you monitored specified performance counters using System Monitor. Then you used Performance Logs And Alerts to create a counter log and an alert for the LDAP Searches/Sec counter.
EAN: N/A
Pages: 244
- Seeing Services Through Your Customers Eyes-Becoming a customer-centered organization
- Success Story #2 Bank One Bigger… Now Better
- Executing Corporate Strategy with Lean Six Sigma
- Success Story #4 Stanford Hospital and Clinics At the forefront of the quality revolution
- Designing World-Class Services (Design for Lean Six Sigma)