Monitor Network Performance
One way to monitor network performance is to use a stopwatch to see how long it takes to complete common network tasks, such as opening documents or printing reports. If you choose to monitor your network by using the stopwatch technique, you may want to get a clipboard, baseball cap, and gray sweat suit, to complete the ensemble.
A more high-tech approach to monitoring network performance is to use a monitor program that automatically gathers network statistics for you. After you set up the monitor, it plugs away, silently spying on your network and recording in performance logs the activity it sees. You can then review those performance logs to see how your network is doing.
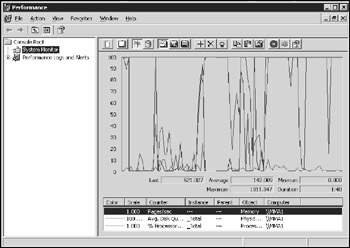
For large networks, you can purchase sophisticated monitoring programs that run on their own, dedicated servers. For small-and medium-size networks, you can probably use the built-in monitoring facilities that come with the network operating system. For example, Figure 18-1 shows the Performance Monitor tool that comes with Windows Server 2003. Other operating systems come with similar tools.

Figure 18-1: Monitoring performance in Windows Server 2003.
The Windows Performance Monitor lets you keep track of several different aspects of system performance at a time. You track each performance aspect by setting up a counter. You can choose from dozens of different counters. Table 18-1 describes some of the most commonly used counters. Note that each counter refers to a server object, such as physical disk, memory, or processor.
| Object | Counter | What It Indicates |
|---|---|---|
| Physical Disk | % Free Space | The percentage of free space on the server's physical disks. The free space should measure at least 15 percent. |
| Physical Disk | Average Queue Length | How many disk operations are waiting while the disk is busy servicing other disk operations. The number of operations should be two or fewer. |
| Memory | Pages/Second | The number of pages retrieved from the virtual memory page files per second. A typical threshold is about 2,500 pages per second. |
| Processor | % Processor Time | The percentage of the processor's time that it is doing work rather than sitting idle. The amount of time should be 85 percent or less. |
To add a counter, follow these steps:
-
In the Performance Monitor, click the Add button to display the Add Counters dialog box, as shown in Figure 18-2.

Figure 18-2: Adding performance counters.The Add button is the one with the Plus sign, as shown in Figure 18-1.
-
Select from the Performance Object drop-down list the object that you want to track, choose the counter that you want to add from the list, and click Add.
You can add more than one counter from this dialog box.
-
When you finish adding counters, click Close to dismiss the Add Counters dialog box.
You can switch the display to a histogram, as shown in Figure 18-3, by clicking the View Histogram button. This action displays your performance counters as bar graphs, which can sometimes make it easier to spot which counter is causing the most activity.
You can also switch the display to Report mode by clicking the View Report button, as shown in Figure 18-4. Here, the performance data is displayed in numeric form.

Figure 18-3: The Performance Monitor in Histogram mode.

Figure 18-4: The Performance Monitor inReport mode.
| Tip | The act of gathering performance data slows down your server, so don't leave performance logging on all the time. Use it only occasionally to gather baseline data or when you're experiencing a performance problem. |