Using Visio Reports throughout the Project
|
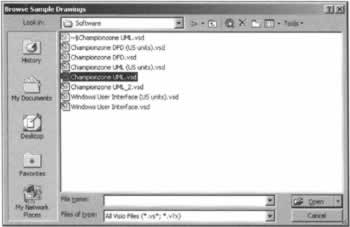
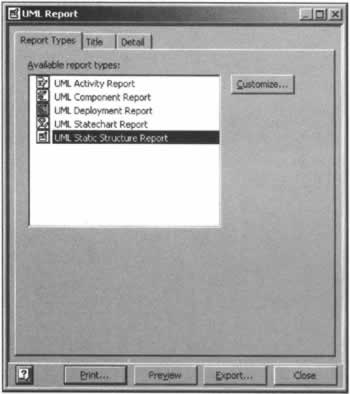
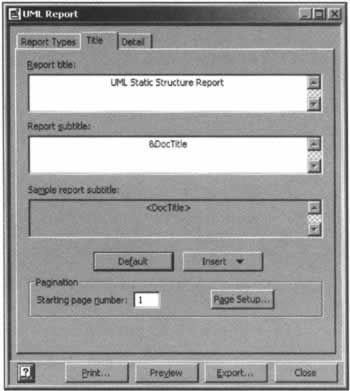
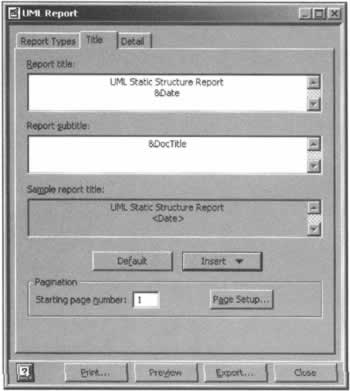
One feature of the UML diagram in Visio is the ability to create professional reports of the detail contained in your drawings. These reports can be shared with the development team and added to any change control policy your organization or project may have in place. Visio UML ships with support for creating reports for static structure (class diagrams), activity, statechart, component, and deployment diagrams. In this section, we'll review the creation of Visio UML reports and discuss the reports you may commonly want to include in your own project work. Each of the reports contains a listing of the contents of the report and quite a bit of detail about each of the components within whichever diagram the report is run for. For instance, an activity diagram report will include each action state and each transition from one state to another. It will also include most of the important UML-related information included in the Visio shape properties. To get started, let's use the sample UML diagram that ships with Visio Enterprise Architect - Championzone UML. This is a fictional application design for referee certification. To open the sample UML model, start Visio and select File | New | Browse Sample Drawings. You'll see an Open File dialog like the screenshot overleaf. Select Champtionzone UML.vsd and press the Open button. This is actually a great sample UML model to review. It contains most of the common UML diagrams that you are likely to encounter. I personally wouldn't have spent the time to format colors and shading, but otherwise, this is a good UML example to use as guidance for your own diagrams. Notice the tab bar at the bottom of the drawing page. If you scroll through the available drawings, you'll find Static Structure, Collaboration, Sequence, Component, Statechart, Deployment, Activity, and Use Case Diagrams. Let's create a report and discuss its contents. We'll start with the Static Structure Report. From the Visio Main menu, find the UML menu and select Reports, and you'll see this dialog: Notice the list of available reports. We are going to run the Static Structure Report, but let's take a moment to review what options are available in this dialog first. Toward the bottom of the dialog, we see buttons to Print, Preview, and Export the report. Printing and previewing reports have obvious benefit, but if we are using our UML reports as a part of a development project, we probably want the information contained in these reports for some historical or change control purpose. For that reason, exporting the reports is a good thing to review. Visio will export our report to Rich Text Format, (RTF). RTF can be read by just about any word processor. The main benefit of exporting your reports is the creation of a file that you can save, include in a change control package, or even add to your source code version-control application like SourceSafe. We'll get to exporting a report shortly; let's finish with the other tabs in this dialog. Click on the Title tab and you see a form that lets you modify the default Title and Subtitle of the report. In the Report title textbox you can add text to be printed at the top of your reports. Changes will be displayed in the Sample Report textbox near the middle of the form. You can also insert common fields like Document Title, Current Date, File Name, and Author. Put your cursor somewhere in the Report title box and press the Insert button. From the list that appears, select Current Date. Depending on where you had the cursor in the Report title box, your display will look something like the following: The Default button will reset whatever changes you made to the report title and subtitle to the original settings. Another option that is convenient is the ability to assign the starting page number of the report. If our report is to be included with other documentation, a project wrap-up document for instance, then we might to start our page numbering well after page one. The Page Setup button opens the standard Page Setup dialog you'd expect to find in any Windows application. The Detail page lets you select what items are to be included in the report itself. These include:
If your diagrams contain a lot of detail stored within the shapes themselves, then turning on all of these options is probably a good idea. If you are not generating code from your diagrams, that option obviously isn't necessary. It will just clutter up the report.
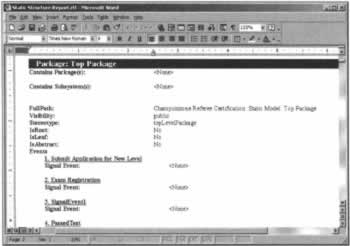
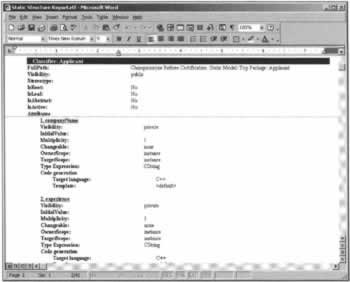
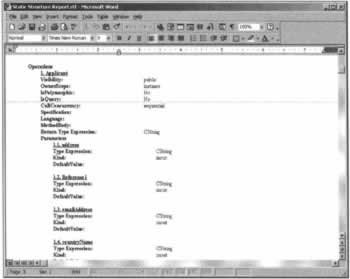
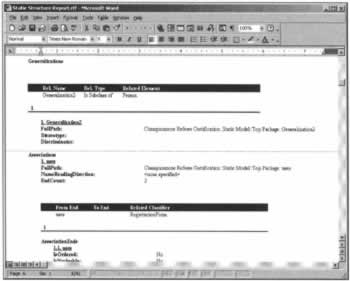
Static Structure Diagram ReportOK, let's generate a Static Structure diagram. Still in the Championzone UML file, from the menu select UML | Reports.... In the dialog that appears select UMLStaticStructure Report, and press the Export button. You'll see a Save File dialog so browse to a directory on your machine and name the report file Static Structure Report. Notice that our only option is to create an RTF file. Press the Save button. The report is generated very quickly. Browse to the directory that contains the new file and open it with a word-processing application. In our case, we're using Microsoft Word. WordPerfect or even WordPad that ships with Windows will work too. The report itself is very long - over 40 pages in Word. It contains all of the detail that is available from the Visio diagram about the Static Structure diagram. Although we won't run through each of the sections of the report in too much detail, let's review a couple of major sections. The first section of the report is a summary of the diagram. It contains the name of the diagram, the model type (in this case Static Structure), it's visibility, and the packages it contains, among other things. The next section is a statistical review of the contents of the diagram. It counts interfaces, classes, the total number of attributes, parameters, etc. It's a lengthy list and I wonder how useful it really is. Other than curiosity, do we care how many methods we have in our entire diagram? In most cases, probably not. The balance of the report is a lot of detail about the packages and classes contained within the diagram. In this sample Static Structure diagram there is only the standard Top Package and it contains all of the classes in the diagram. In Word the header of the Package section looks like this: Each class within the diagram has its own section as well. The details in these class detail sections are probably the most useful in terms of documentation. Here's what the Applicant class looks like in the report: Notice the Attributes of the class are listed with a large amount of detail for each attribute including Visibility, scope, and instancing information. Also, notice the Code generation section of the Attributes detail. In this diagram the diagram author chose C++ and the default code template. The Operations of the class follow its Attributes. That section if formatted similarly, as the following screenshot illustrates: Each operation is listed with a tremendous amount of detail about the operation, its scope, and all of the input and output parameters. You can see why these reports can get so long - there's a lot of information included for even the most simple of attributes and operations. One nice feature about the Operations section if you've included Code Generation detail in the report is information about the code that was generated. Specifically, where the code file is and what language was used to generate the code. The last portion of the class detail in this report is information that describes the associations our class has with other classes. This information is probably the second most useful data contained within the report, behind details about attributes and operations. We won't review the meaning of generalizations and associations in a UML context, but here's what the report tells use about the Applicant class in this particular Static Structure diagram:
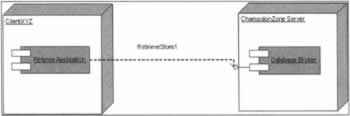
Deployment Diagram ReportAfter a Static Structure diagram report, another useful report is the Deployment diagram report. It includes a detailed listing of Nodes and Components contained within the Deployment diagram. In the case of our Championzone UML example, the diagram is rather simple so the report is much smaller than our previous example. It's only three pages. The diagram itself contains two Nodes and each Node contains one Component. The report itself is nicely compact (I wonder about the pages and pages of detail in the Static Structure report and how much it will get used). The report contains details about the Top Package just like our Static Structure report. Then, each node (ClientXYZ and ChampionZone Server) has its own sections of the report. The deployment report can easily be created and distributed to development, support, and implementation groups. Given the lack of overwhelming detail that we found in the Static Structure report, we can expect team members in these other groups to use and understand the contents of this report, making it much more valuable throughout the entire project lifecycle.
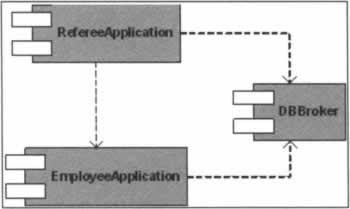
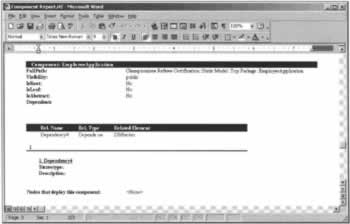
Component ReportThe last report we'll look at in this section is the Component Report. It is very closely related to the Deployment report, but provides us with a bit more information about our components and their relationships to one another. In the Championzone UML example the Component diagram looks like this: Like the Deployment diagram, it is simple and easy to understand. We can therefore expect the report to be simple and easy to understand. The information that a Component diagram, and hence its report, contains that we don't find in a Deployment diagram is dependency or relationships with other components. The diagram shows those dependencies as dashed lines. In the report, we see those dependencies as sub sections, as the following screenshot illustrates: In this report, we see that the component named EmployeeApplication is dependent upon the component named DBBroker. If the diagram included Node information for the DBBroker component, that detail would also be displayed. It is probably reasonable to expect Component and Deployment diagrams and their reports to be used together.
| |||||||||||||||||||||||||||||||||||

EAN: N/A
Pages: 85