Grouping Data on a Report
| Grouping allows you to aggregate items within a group and, in turn , to generate reports with complex formatting. Chapter 8, "Expressions," covered a set of aggregation functions. Aggregation functions help grouping scenarios by providing totals for groups and subtotals for subgroups. The relationship between an aggregation function and group is controlled by scope. This relationship becomes useful when, for example, a user needs to see what percentage of a total a particular line item is. In the examples from previous chapters, you have seen summarizations that can be done in data regions, such as the Table, Matrix, Chart, and List data regions . Most scenarios employ grouping in SSRS to aggregate data and generate summary information. Concepts applicable to aggregation in SSRS are very similar to those applicable to the GROUP BY expression in SQL. However, unlike a query, which allows for very limited formatting, SSRS is practically unlimited in its formatting capabilities. As in many cases in software development, choosing a particular approach is based on several key factors: performance, scalability, elegance , and development time. This is a "magic" formula. The complex part of this is to find the best balance that can solve this "magic." The best solution is to experiment with various approaches and find the best for a particular application. In almost all cases, using SQL for grouping provides the best performance. However, a static SQL statement is not very flexible. The SQL statement might be too complex, lose its elegance, and, especially , not provide required formatting. It might be hard for a developer, who just started working on a newly developed reporting system, to determine what a complex query is doing and why it is not producing the correct result. The following are some tips to help strike a balance between SSRS' ability to group and SQL:
For example, the following query to retrieve a summary of all line items for each order with the result displayed in a Table report item will execute several times faster than using a Table report item to accomplish the same grouping. [View full width]
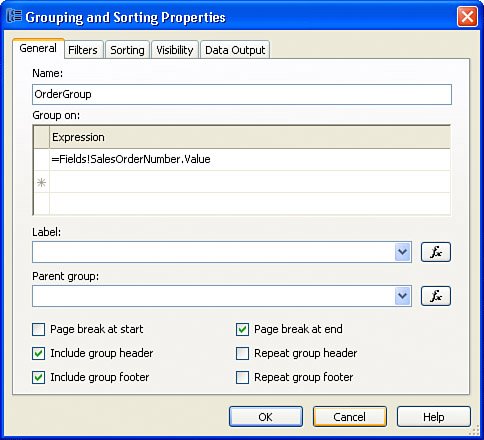
The Grouping and Sorting Properties dialog box provides an interface to edit groups for Matrix, Table, List, and Chart. See Figure 12.1 to view the Grouping and Sorting Properties dialog box for a Table Group. Figure 12.1. Grouping and Sorting Properties dialog box. The Grouping and Sorting Properties dialog box will vary slightly in check boxes at the bottom, depending on the report item. For example, List only has Page Break at Start and Page Break at End check boxes. The following are procedures to display grouping properties:
The number of available grouping properties varies, but Name , Group on Expression (allows for multiple expressions), Document Map Label (or simply label in the case of a Chart item), and Parent Group are always available. The RDL that describes grouping is as follows : <Grouping Name="OrderGroup"> <GroupExpressions> <GroupExpression>=Fields!SalesOrderNumber.Value</GroupExpression> </GroupExpressions> </Grouping> |
EAN: 2147483647
Pages: 254