Chart Report Item
| A Chart report delivers a graphic presentation of data. Chart has comprehensive functionality and is very similar by capabilities to an Excel chart, including a variety of chart types, 3D effects, and more. Unlike an Excel chart, the SSRS Chart does not build a trend line internally; however, this limit can be overcome by calculating values for a trend line in the data set and then providing it to a chart. Note For examples and explanations about charts , this book uses Chart type = Column chart . This is the default type of chart that Report Designer adds to a report. The Chart control used in this release of Reporting Services is licensed from Dundas Software (www.dundas.com). You can obtain an add-on pack for Reporting Services from Dundas Software. Figure 11.9 shows a Design-time view of a chart. Figure 11.9. Design-time picture of a chart.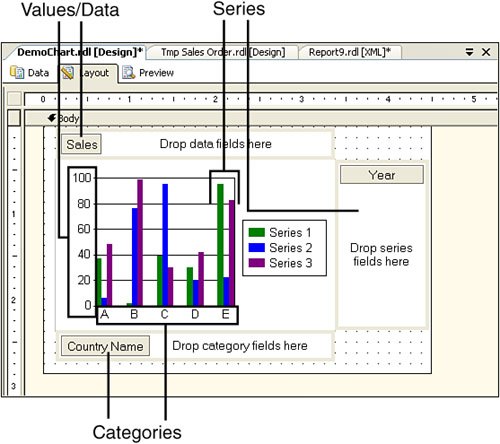 The Chart Properties dialog box (see Figure 11.10) provides an interface to access chart properties. To access this dialog box, right-click on a chart and select Properties from the shortcut menu. Figure 11.10. Chart Properties dialog box.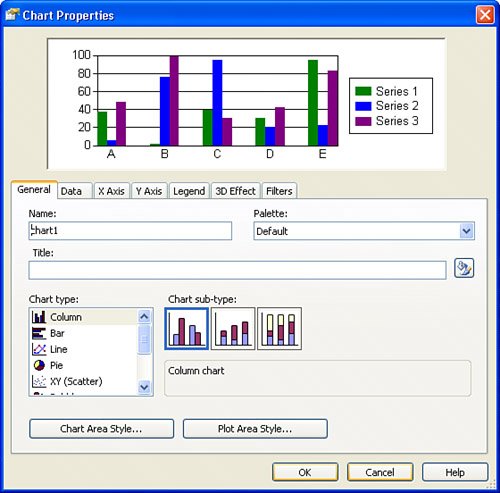 Tip You might have noticed that it is not possible to control label orientation. The x-axis label orientation is determined automatically by the chart control based on the available space. You can try to adjust the dimensions of a chart to achieve the desired result. Alternatively, for example in a case of a column chart, you can try to achieve the desired orientation with a matrix aligned to a chart's. |
EAN: 2147483647
Pages: 254
- ERP System Acquisition: A Process Model and Results From an Austrian Survey
- The Second Wave ERP Market: An Australian Viewpoint
- The Effects of an Enterprise Resource Planning System (ERP) Implementation on Job Characteristics – A Study using the Hackman and Oldham Job Characteristics Model
- Context Management of ERP Processes in Virtual Communities
- A Hybrid Clustering Technique to Improve Patient Data Quality
- MPLS VPN Basic Configuration
- OSPF PE-CE Routing Protocol Overview, Configuration and Verification
- MPLS TE Theory
- Case Study 2: Implementing Multi-VRF CE, VRF Selection Using Source IP Address, VRF Selection Using Policy-Based Routing, NAT and HSRP Support in MPLS VPN, and Multicast VPN Support over Multi-VRF CE
- Case Study 9: Implementing VPLS Services with the GSR 12000 Series