Prerequisites
Next we’ll look at SVG. The SVG 1.0 spec, which Batik supports, is over 600 pages long, so we can only give you a flavor of what you’ll be able to do with it. SVG is limited to two-dimensional graphics, but it includes some elements for incorporating raster (bitmapped) graphics as well. We’ll look at the static aspects of SVG first (the drawing stuff) and then look at the dynamic aspects.
Static SVG
We’ll start our tour of SVG with the following picture. It was described using SVG and rendered as a JPEG using Batik’s SVG renderer functionality. It shows some of the basic shape functionality that’s part of SVG.
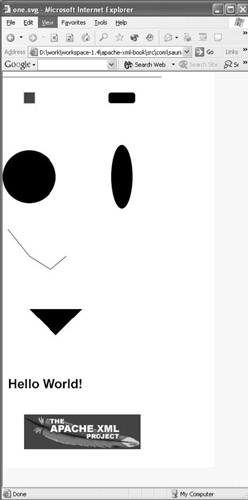
The SVG that created this image is as follows. The elements appear in the order (top to bottom, left to right) that they appear in the SVG document:
1: <?xml version="1.0" encoding="UTF-8"?> 2: <!DOCTYPE svg PUBLIC "-//W3C//DTD SVG 1.0//EN" 3: "http://www.w3.org/TR/2001/REC-SVG-20010904/DTD/svg10.dtd">
You can obtain the SVG DTD via the W3C’s Website and use it to validate SVG documents.
The root element of an SVG document is <svg>. The width and height attributes specify the width and height of the SVG relative to the surrounding context (if any):
4: <svg xmlns="http://www.w3.org/2000/svg" 5: xmlns:xlink="http://www.w3.org/1999/xlink" 6: width="400" height="750">
You can specify the values for width and height using a unit of measure such as px (pixels), em, cm, or any other unit dimension defined by CSS. If no unit is specified (as is the case in this example), then the unit is the unit of measure in the current user coordinate system. Note that SVG namespace is the default namespace for this document. You also declare the xlink prefix for use later on.
The <title> and <desc> elements allow you to provide additional documentation for your SVG. These elements may appear in many SVG elements:
7: <title>one.svg</title> 8: <desc>Sample SVG File</desc>
Generally, the contents of these elements aren’t rendered by an SVG user agent, although they may provide information the user-agent can use. An example would be using the contents of <title> to produce tooltip-style documentation as the user moves the cursor over various parts of an SVG document.
The <g> element is used to group related graphics elements. It’s useful because you can give a group a name using the id attribute. The name is needed for some of the SVG animation elements and allows groups of graphics elements to be reused within a document:
9: <g >
The <line> element draws a line between two points. The coordinates for the first point are described by the x1 and y1 attributes, and the coordinates for the second point are described by the x2 and y2 attributes:
10: <line x1="0" y1="10" x2="300" y2="10" stroke="black"/>
A number of additional attributes control various aspects of a graphics element’s appearance. The stroke attribute controls the color of the pen used to make a drawing stroke. You can use simple color names, or you can use any CSS2 color specification.
Lines 12-15 show examples using the <rect> element to draw rectangles. The x attribute specifies the x coordinate of the side of the rectangle that has the smallest x-coordinate in the current user coordinate system. Similarly, the y attribute specifies the y coordinate of the side of the rectangle that has the smallest y-coordinate in the current user coordinate system. The values of the x and y attributes default to zero. Note that you’re specifying the coordinates of a single side, so the x and y attributes together specify two sides of the rectangle. The width and height attributes must specify positive offsets (in the current user coordinate system) for the width (x-axis) and height (y-axis) of the rectangle. A width or height value of zero prevents the rectangle from being drawn:
11: </g> 12: <g > 13: <rect x="40" y="40" width="20" height="20" 14: style="stroke:red; fill:blue"/> 15: <rect x="200" y="40" width="50" height="20" rx="5" ry="5"/>
The style attribute in line 14 shows an alternate method of controlling the formatting of a graphics element. Instead of using a separate attribute for each presentation property (such as stroke="" fill=""), you can specify a style attribute and use CSS notation to do the same thing. The names of the CSS properties and the presentation attributes are the same. The advantage of doing it this way is that it may be more familiar to people using CSS, and it saves a few keystrokes. The disadvantages fall to the implementor of SVG processors. Having separate attributes means the XML processor does the work of digging out the presentation attribute values. If you use the style attribute approach, then your code must take the style attribute and parse its contents in order to get the presentation values. Here, stroke specifies the color of the pen strokes (red) and fill specifies the color (blue) used to fill the rectangle.
The <rect> example in line 15 adds one more twist. By specifying the rx and ry attributes, you can create a rectangle with rounded corners. The rx and ry attributes control the x-axis and y-axis radii, respectively, of the ellipse that’s used to round off the corners of the rectangle.
The <circle> element draws a circle centered at the point specified by the cx and cy attributes. The radius of the circle is controlled by the r attribute. The <ellipse> element is very similar, except that it has two radius attributes: rx for the x-axis radius and ry for the y-axis radius:
16: </g> 17: <g > 18: <circle cx="50" cy="200" r="50"/> 19: <ellipse cx="225" cy="200" rx="20" ry="60"/>
<polyline> and <polygon> both rely on the points attribute, which contains a list of points. The x and y coordinates of the points are separated by commas, and the coordinate pairs themselves are separated by spaces. <polyline> starts with the first coordinate pair and then draws a line to the next coordinate pair. Generally, you use <polyline> when you want an open shape, because a closed shape is really a polygon. <polygon> does what <polyline> does, except that it also draws a line from the last coordinate pair to the first coordinate pair, creating a closed figure:
20: </g> 21: <g > 22: <polyline fill="none" stroke="black" 23: points="10,300 50,350 90,375 120,350"/> 24: <polygon points="50,450 100,500 150,450"/>
The penultimate graphics element in this file is <text>, which draws its content as a text string. The x and y attributes determine the position of the text. Again, you use the style attribute and CSS2 property names to control the font attributes to be applied to the text:
25: </g> 26: <g > 27: <text x="10" y="600" 28: style="font-family:Arial; font-size:24; font-weight:bold;"> 29: Hello World! 30: </text>
The last example shows the use of the SVG <a> and <image> elements. The <image> element allows you to include a raster image file in your SVG output. The x and y attribute specify the position of one corner of the rectangle where the image will appear, and the height and width attributes control the size of the rectangle:
31: </g> 32: <g > 33: <a xlink:href="http://xml.apache.org"> 34: <image x="40" y="650" width="220px" height="65px" 35: xlink:href="http://xml.apache.org/images/group-logo.gif"/> 36: </a> 37: </g> 38: </svg>
<image> uses XLink’s href attribute to specify the location of the image file. Actually, SVG uses XLink to specify all linking type behavior. The <image> element appears as the content of an <a> element. This usage of the SVG <a> element works just like the HTML usage, except that it uses XLink’s href attribute. The target of the link may be any resource, not just an SVG resource. The one caveat is that the user agent displaying the SVG document where the link is clicked must be able to display the resource the link points to. In addition, any number of SVG graphics elements may appear as the contents of the <a>; an XLink simple link is created for each graphics element.
Container Elements
Some SVG elements fall into one of two special categories: container elements or graphics elements. The container elements you’ve seen so far are <svg>, <g>, and <a>. The <line> <rect>, <circle>, <ellipse>, <polyline>, <polygon>, <text>, and <image> elements are graphics elements. The <title> and <desc> elements may appear inside any container or graphics element. This capability can be useful for documenting various aspects of your drawing inside the SVG file.
In sophisticated documents, you’d like to be able to define and use sets of graphics elements. Reusable elements can be defined by attaching an id attribute to any <svg>, <symbol>, <g>, or graphics element. These elements can then be inserted into your document via the <use> element. Let’s look at a simple example:
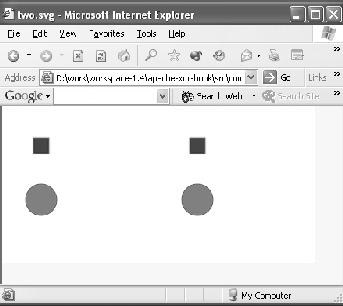
In this figure, you want to define the blue square and grey circle as reusable visual elements. The following code shows how to do this:
1: <?xml version="1.0" encoding="UTF-8"?> 2: <!DOCTYPE svg PUBLIC "-//W3C//DTD SVG 1.0//EN" 3: "http://www.w3.org/TR/2001/REC-SVG-20010904/DTD/svg10.dtd"> 4: <svg xmlns="http://www.w3.org/2000/svg" 5: xmlns:xlink="http://www.w3.org/1999/xlink" 6: width="400" height="200"> 7: <title>two.svg</title> 8: <desc>Sample SVG file showing reuse</desc> 9: <defs> 10: <g > 11: <rect x="40" y="40" width="20" height="20" 12: style="stroke:red; fill:blue"/> 13: <circle cx="50" cy="120" r="20" 14: style="stroke:green; fill:gray"/> 15: </g> 16: </defs>
You begin by defining a <g> containing your rectangle and circle. The id for the <g> is group, which is how you’ll refer to the combination later in the document. The <g> is placed inside a <defs> element. The convention in SVG is to place elements that will be referenced by other elements inside a <defs>. You can think of a <defs> as a <g> that isn’t rendered by an SVG renderer. The <defs> and its children appear in the source document and the SVG DOM for the source document.
Now you insert the combination with the <use> element. XLink’s href is used for maximum flexibility:
17: <g> 18: <use xlink:href="#group" /> 19: </g>
In order to place the second combination in the right location, you create a <g> that translates the coordinate system of its children by adding 200 to the x-coordinate. Now the elements referenced by the <use> element will all be translated and will appear to the right of the first instance of the combination:
20: <g transform="translate(200,0)"> 21: <use xlink:href="#group" /> 22: </g> 23: </svg>
The Transform Attribute
The last section introduced the transform attribute. This attribute can be attached to the <g>, <defs>, <use>, or any graphics element. The value of a transform attribute is a space-separated list of transforms:
-
matrix(a b c d e f)—Apply the transformation matrix specified by the vector [a, b, c, d, e, f], which corresponds to the following 3x3 transformation matrix:
-
a b c
-
d e f
-
0 0 1
-
-
translate(tx,ty)—Translate all coordinates by adding tx to the x coordinate and ty to the y coordinate.
-
scale(sx, sy)—Scale all coordinates by multiplying each x coordinate by sx and each y coordinate by sy.
-
rotate(angle, cx, cy)—Rotate all coordinates by angle, with the center of rotation at cx, cy.
-
skewX(angle)—Skew all x coordinates by the angle.
-
skewY(angle)—Skew all y coordinates by the angle.
Transformations in the list are applied in the order they appear.
The Path Element
The last major SVG topic we’ll look at is the <path> element. This element lets you specify the outline of a shape. In fact, the function of all the graphics elements can be accomplished by using <path>. However, in many cases it’s more convenient to use a specific graphics element. As you’ll see, though, <path> can do some things that none of the other elements can do, so when you need to use <path>, you really need to use it.
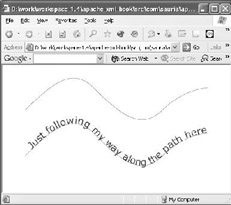
The following figure shows <path> in action:
This SVG element uses the viewBox attribute to indicate that the area specified by the width and height attributes is mapped to a coordinate system range. So, the 5-inch by 3-inch drawing area will be covered by a viewBox that has a minimum x coordinate of 0, a minimum y coordinate of 0, a width of 800 pixels, and a height of 600 pixels:
1: <?xml version="1.0" standalone="no"?> 2: <!DOCTYPE svg PUBLIC "-//W3C//DTD SVG 20010904//EN" 3: "http://www.w3.org/TR/2001/REC-SVG-20010904/DTD/svg10.dtd"> 4: <svg width="5in" height="3in" viewBox="0 0 800 600" 5: xmlns="http://www.w3.org/2000/svg" 6: xmlns:xlink="http://www.w3.org/1999/xlink">
The <path> element takes a d attribute that contains a list of path commands. The M command sets the current point to an absolute x and y position without drawing. The C command takes a sets of three coordinate pairs (x1, y1, x2, y2, x, y) and draws a cubic B zier curve using the current point as the start of the curve; x1, y1 as the control point of the beginning of the curve; x2, y2 as the control point of the end of the curve; and x, y as the end of the curve. After the curve has been drawn, the current point is at x, y:
7: <g > 8: <path style="stroke:black; fill:none" 9: d="M 0 200 10: C 100 100 200 0 300 100 11: C 400 200 500 300 600 200 12: C 700 100 800 100 800 100"/>
The <textPath> element must appear inside a <text> element. Here you use the enclosing <text> element to control the font properties of the text. The content of the <textPath> element is drawn along a path specified using an XLink href attribute. The startOffset attribute specifies where along the path to begin drawing the text. Its value is an offset from the beginning of the path:
13: </g> 14: 15: <g transform="translate(0,200)"> 16: <path style="stroke:blue; fill:none" 17: d="M 0 200 18: C 100 100 200 0 300 100 19: C 400 200 500 300 600 200 20: C 700 100 800 100 800 100"/> 21: <text font-family="Verdana" font-size="42.5" fill="blue" > 22: <textPath xlink:href="#followMe" startOffset="40"> 23: Just following my way along the path here 24: </textPath> 25: </text> 26: </g> 27: </svg>
The <path> element has a rich set of drawing commands. There are two versions of every command—an uppercase version that uses absolute coordinates and a lowercase version that uses relative coordinates:
-
M/m(x, y)—Start a new subpath at (x, y).
-
Z/z—Close the current path by drawing a line to the starting point.
-
L/l(x, y)+—Draw a line from the current point to (x, y). If there are multiple (x, y) pairs, then go on drawing lines from one pair to the next.
-
H/h(x)—Draw a line from the current point (curX, curY) to (x, curY).
-
V/v(y)—Draw a line from the current point (curX, curY) to (curX, y).
-
C/c(x1 y1 x2 y2 x y)—Draw a cubic B zier curve using the current point as the start of the curve, (x1, y1) as the control point for the start of the curve, (x2, y2) as the control point for the end of the curve, and (x, y) as the end of the curve.
-
S/s(x2 y2 x y)—Draw a cubic B zier curve from the current point to (x, y), using (x2, y2) as the second control point. Assume that the first control point is a reflection of the second control point on the previous point (relative to the current point) or the current point if the last command was not C, c, S, or s.
-
Q/q(x1 y1 x y)—Draw a quadratic B zier curve from the current point to (x, y), using (x1, y1) as the control point.
-
T/t(x y)—Draw a quadratic B zier curve from the current point to (x, y), assuming the control point is a reflection of the control point for the previous command relative to the current point. If the previous command was not a Q, q, T, or t, the use the current point as the control point.
-
A/a(rx ry x-axis-rotation large-arc-flag sweep-flag x y)—Draw an elliptical arc from the current point to (x, y). The size and orientation of the ellipse are controlled by rx (x axis radius), ry (y axis radius), and x-axis-rotation. The center of the ellipse is calculated automatically. The large-arc flag and sweep-flag are used to select which of the four possible arc segments are drawn. If large-arc-flag is 1 then the arc drawn will be one of the two arcs that sweep out more than 180 degrees. If the sweep flag is 1 then the arc that follows the positive angle direction will be drawn.
This has been a quick primer on the features of static SVG. There are a host of things we couldn’t cover, but we’ve given you a feel for the types of things you can do with SVG.
Dynamic SVG
Now that you have static SVG under your belt, we can turn to dynamic SVG. Dynamic SVG means the SVG image isn’t static. You can take static SVG drawings and cause them to come to life. There are two ways to do this: You can use what we’ll call an imperative style, or you can use a declarative style.
Imperative Dynamic SVG
The imperative style of doing dynamic SVG will remind you of Dynamic HTML (DHTML). It combines the SVG document, a representation of the DOM for the SVG document, and a scripting language. The scripts interact with the SVG DOM and with event handlers specified on SVG elements. By updating elements and attributes in the SVG DOM, the scripts cause the SVG being displayed to change without reloading the document.
It’s hard to show a dynamic SVG application on paper, but here is a picture of the starting point of a simple imperative SVG file, imperative-dynamic.svg:
The first part is normal—just what you’re used to seeing:
1: <?xml version="1.0" standalone="no"?> 2: <!DOCTYPE svg PUBLIC "-//W3C//DTD SVG 20010904//EN" 3: "http://www.w3.org/TR/2001/REC-SVG-20010904/DTD/svg10.dtd"> 4: <svg width="300" height="150" 5: xmlns="http://www.w3.org/2000/svg" 6: xmlns:xlink="http://www.w3.org/1999/xlink">
Next you see a script element that contains a script written in the language specified by the type attribute. In this case you’re using ECMAScript (JavaScript). The function randomColor generates three random numbers between 0 and 256 (it uses parseInt to convert them to integers because ECMAScript treats everything as a floating-point number) and converts them to hexadecimal. (The 16 argument to toString is the number base.) The three numbers are then concatenated and prefixed with # to generate a color value:
7: <script type="text/ecmascript"> 8: function randomColor(){ 9: var r = parseInt(Math.random() * 256).toString(16); 10: var g = parseInt(Math.random() * 256).toString(16); 11: var b = parseInt(Math.random() * 256).toString(16); 12: var color = "#"+r+g+b; 13: return color; 14: } 15: </script> The <rect> element has an onclick attribute. This is an event handler attribute containing a piece of script code that’s executed when the event click occurs (that is, when a mouse click is detected inside the <rect>). The code takes the event (evt) and finds its target, which is the <rect> element. The setAttribute method on this element is called to change the value of the fill attribute to be the result of calling the randomColor method defined earlier. The net result is that every time you click the mouse on the rectangle, it changes to a new color:
16: <rect x="10" y="10" width="100" height="100" 17: onclick="evt.target.setAttribute('fill', randomColor())"/> 18: </svg> In this example, you specify the scripting language on the <script> tag. Alternatively, you could specify it for the entire document by placing a contentScriptType attribute on the root <svg> element. Because the default for that attribute is text/ecmascript, you could omit the type attribute altogether.
By attaching event handlers to various objects in your SVG drawing, you can create a nice interactive user interface for an application. The event handlers can update various parts of the document to animate various aspects of the interface. You can also use scripting to generate animations. To do this effectively, you need to know what event handlers are available. Here’s a group of event handlers that can be attached to any container or graphics element:
-
onfocusin—Fires when the element receives the focus.
-
onfocusout—Fires when the element loses the focus.
-
onactivate—Fires when the element is activated.
-
onclick—Fires when the mouse is clicked (up and down) over the element.
-
onmouseup—Fires when the mouse button is released over the element.
-
onmousedown—Fires when mouse button is pressed down over the element.
-
onmouseover—Fires when the mouse is moved into/over the element.
-
onmousemove—Fires when the mouse is moved inside the element.
-
onmouseout—Fires when the mouse leaves the element.
-
onload—Fires when the document is loaded.
The following events are fired only at the document level:
-
onunload—Fires when the document is removed from the user-agent window or frame. This event applies only to the outermost <svg> element.
-
onabort—Fires when page loading is interrupted.
-
onerror—Fires when the page doesn’t load correctly, or when an error occurs during script execution.
-
onresize—Fires when the document window is resized. This event applies only to the outermost <svg> element.
-
onscroll—Fires when the document window is scrolled. This event applies only to the outermost <svg> element.
-
onzoom—Fires when the document window is zoomed. This event applies only to the outermost <svg> element.
Imperative dynamic SVG gives you the most control over the dynamic behavior of your document because you can attach any behavior to any element, and because you can replace elements in the SVG DOM tree with elements of your choosing (subject to the grammar rules of SVG). Sometimes you don’t need all the power and flexibility of this approach. In particular, there are times when you want relatively simple animations of SVG elements. These situations are candidates for the use of declarative dynamic SVG.
Declarative Dynamic SVG
In imperative dynamic SVG, you tell the user agent exactly how to implement dynamic behavior: You write a program or series of programs in a scripting language. You don’t have to do this in declarative dynamic SVG. Under this model, you tell SVG what animation you’d like to see, and the implementation of the SVG engine or user agent is responsible for figuring out how to make the animation come to life.
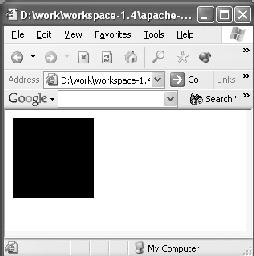
Let’s look at a simple animation example. This figure shows the initial state of the animation—a simple green rectangle. The animation should make the green box move from the left end of the viewable area to the right end, jump back to the left end, and repeat the movement.
Here’s an SVG document that produces the animation:
1: <?xml version="1.0" encoding="UTF-8"?> 2: <!DOCTYPE svg PUBLIC "-//W3C//DTD SVG 1.0//EN" 3: "http://www.w3.org/TR/2001/REC-SVG-20010904/DTD/svg10.dtd"> 4: <svg xmlns="http://www.w3.org/2000/svg" 5: xmlns:xlink="http://www.w3.org/1999/xlink" 6: width="5in" height="1in" viewBox="0 0 800 200"> 7: <defs> 8: <symbol > 9: <rect x="0" y="50" height="20" width="50" fill="green"/> 10: </symbol> 11: </defs>
You define the <rect> as a <symbol> so that you can use it in the animation. Think of a <symbol> as a <g> that doesn’t get rendered.
Now you use the <rect> that causes it to render. The <animate> element does all the work. In this case the animation is of the x attribute. The animation takes 2 seconds and is repeated twice. The fill attribute says to freeze the animation at the end:
12: <use xlink:href="#box"> 13: <animate attributeName="x" dur="2s" repeatCount="2" 14: fill="freeze" 15: values="0; 100; 200; 300; 400; 500; 600; 700; 800;"/> 16: </use> 17: </svg>
The animation works by taking the values from the values attribute and updating the x attribute (attributeName) with them. The animate tag figures out when each value should be used by dividing the duration by the number of values. It then interpolates intermediate values for the x attribute and time so that the animation looks smooth. To change multiple attributes at the same time, you specify multiple <animate>elements. These elements are copies of the original <animate> but update a different attributeName and have a different set of values.
You can attach two other important attributes to <animate>. The keyTimes attribute lets you specify a list of times. Each entry in keyTimes corresponds to a value in the values attribute. The time values are specified as floating-point numbers between 0 and 1, as a proportional offset into the total duration of the animation.
The calcMode attribute determines how the SVG engine does the interpolation. The values include:
-
discrete—No interpolation.
-
linear—Simple linear interpolation between the values.
-
paced—A constant pace of motion in the animation.
-
spline—Interpolation from one value to the next using a cubic B zier spline. The control points for each spline are specified in the keySplines attribute, one per entry in the keyTimes attribute. Each control point entry includes four values.
SMIL Animation Elements
The declarative animation features of SVG were done in collaboration with the developers of the W3C’s Synchronized Multimedia Integration Language (SMIL). This means SVG is a host language for SMIL animation. SVG has extended the set of animation elements from SMIL with some SVG-specific elements. The elements that came from SMIL include <animate>, <animateColor>, and <animateMotion>. <animateColor> allows you to animate the color of an element in the same style as <animate>. The <animateMotion> element allows you to animate the motion of an element along a path. Here’s an example using <animateMotion> that uses the same green rectangle but animates it along a path:
1: <?xml version="1.0" encoding="UTF-8"?> 2: <!DOCTYPE svg PUBLIC "-//W3C//DTD SVG 1.0//EN" 3: "http://www.w3.org/TR/2001/REC-SVG-20010904/DTD/svg10.dtd"> 4: <svg xmlns="http://www.w3.org/2000/svg" 5: xmlns:xlink="http://www.w3.org/1999/xlink" 6: width="5in" height="2in" viewBox="0 0 800 400"> 7: <defs> 8: <symbol > 9: <rect x="0" y="50" height="20" width="50" fill="green"/> 10: </symbol> 11: </defs> 12: <use xlink:href="#box"> 13: <animateMotion dur="3s" repeatCount="2" 14: fill="freeze" 15: rotate="auto" 16: path="M 0 200 17: C 100 100 200 0 300 100 18: C 400 200 500 300 600 200 19: C 700 100 800 100 800 100"/> 20: </use> 21: </svg>
<animateMotion> shares some of the same attributes as <animate>, but it adds a couple of its own: rotate, and path. The path attribute specifies a path the animation is to follow. The rotate attribute allows you to control how the animated object rotates. Specifying auto means the object rotates by the angle of the direction of the motion path (directional tangent vector of the path at each point). You can also specify auto-reverse, which means the same thing as auto except the angle is 180 degrees minus the angle of the direction of the motion path. Specifying a number gives you a one-time rotation relative to the x-axis of the current coordinate system.
The major SVG extension to the SMIL animation elements is <animateTransform>. It allows you to animate an object using SVG transforms. Again, we’ll use an example with the now-familiar green rectangle:
1: <?xml version="1.0" encoding="UTF-8"?> 2: <!DOCTYPE svg PUBLIC "-//W3C//DTD SVG 1.0//EN" 3: "http://www.w3.org/TR/2001/REC-SVG-20010904/DTD/svg10.dtd"> 4: <svg xmlns="http://www.w3.org/2000/svg" 5: xmlns:xlink="http://www.w3.org/1999/xlink" 6: width="5in" height="2in" viewBox="0 0 800 400"> 7: <defs> 8: <symbol > 9: <rect x="0" y="50" height="20" width="50" fill="green"/> 10: </symbol> 11: </defs> 12: <use xlink:href="#box" transform="translate(50,100)">
The translation on the <use> moves the box so that the entire rotation is visible.
The type attribute specifies that this is a rotation transformation. The values for the rotation angle go from 0 degrees to 720 degrees. The additive attribute specifies that this transformation is added to any other transformations that come before it (in particular the translate on the <use> element). Otherwise, the transformation ignores any transformations coming before it:
13: <animateTransform attributeName="transform" attributeType="XML" 14: dur="2s" repeatCount="2" 15: type="rotate" from="0" to="720" 16: additive="replace" fill="freeze"/> 17: </use> 18: </svg>
In addition to the additive attribute, there is an accumulate attribute on <animateTransform> that controls whether each iteration replaces the previous one (value is "replace") or builds on it (value is "sum").
There are also event handlers associated with the animation elements:
-
onbegin—Fires at the beginning of the animation.
-
onend—Fires at the end of the animation.
-
onrepeat—Fires when the animation repeats itself.
This quick overview of declarative dynamic SVG has given you an idea of the capabilities available to you.
EAN: 2147483647
Pages: 95