Improving Your Queries with the SQL Query Analyzer
| for RuBoard |
As you've seen from some of the examples in this book thus far, the Query Analyzer is a handy tool that enables you to send queries to the database and display the results. This makes it an effective debugging tool, particularly in debugging queries embedded in stored procedures.
However, the Query Analyzer also offers several options that will help you to greatly increase the performance of your queries.
 | A note to more experienced readers: The Query Analyzer does things you should be doing anyhow but if you haven't, it's a great way to get them done. |
Before attempting to use the Query Analyzer, let's create a large test table.
Loading the Database with Sample Data
Add the LoadTestData stored procedure in Listing 23.2 to your Northwind database. This table will be used for testing purposes in this hour . LoadTestData creates a table containing a number of common fields. It then proceeds to add @rowcount number of data rows to the table, passed in as the only parameter.
Listing 23.2 An Example of the RequiredField Control
CREATE PROCEDURE LoadTestData (@rowcount bigint) AS if exists (select * from dbo.sysobjects where id = object_id(N'[dbo].[TestData]') and OBJECTPROPERTY(id, N'IsUserTable') = 1) drop table [dbo].[TestData] CREATE TABLE [dbo].[TestData] ([TestID] [int] IDENTITY (1, 1) NOT NULL , [Name] [varchar] (40) COLLATE SQL_Latin1_General_CP1_CI_AS NOT NULL , [Address] [varchar] (50) COLLATE SQL_Latin1_General_CP1_CI_AS NOT NULL , [Address2] [varchar] (50) COLLATE SQL_Latin1_General_CP1_CI_AS NULL , [City] [varchar] (30) COLLATE SQL_Latin1_General_CP1_CI_AS NOT NULL , [State] [char] (2) COLLATE SQL_Latin1_General_CP1_CI_AS NOT NULL , [Zip] [varchar] (10) COLLATE SQL_Latin1_General_CP1_CI_AS NOT NULL , [Description] [varchar] (500) COLLATE SQL_Latin1_General_CP1_CI_AS NULL) ON [PRIMARY] declare @identity bigint select @identity = 0 WHILE (@identity < @rowcount) BEGIN INSERT INTO TestData ([Name], Address, City, State, Zip, [Description]) VALUES ('Jason Lefebvre', '11 Longfellow St.', 'Pawtucket', 'RI', 'Zip', 'The quick brown fox jumps over the lazy dog. The quick brown fox jumps over the  lazy dog. The quick brown fox jumps over the lazy dog.') select @identity = @@IDENTITY END
 After the LoadTestData stored procedure from Listing 23.2 is in the Northwind database, open an instance of the SQL Query Manager. On my machine, I loaded three million rows to ensure a good test. This created approximately 1.7 gigabytes of data. You'll probably want to create significantly fewer rowson the order of 100,000 rows or so.
Showing the Query Execution Plan
Now that you have the sample data loaded into your database, enter a simple query that returns the name, address, and city of the record at TestID of 70000. You'll find that the query does not perform very well. In fact, this query took almost two full minutes to complete! This would definitely appear to slow down our ADO.NET code.
Fortunately, the Query Analyzer can shed some light on why the query is running slowly. Click on the Query menu item and then select Display Estimated Execution Plan. Then, run the query again. You'll notice an additional tab labeled Execution Plan at the bottom of the screen. After the query is done running, you can click on that tab to see how SQL Server spent its time processing your query. By hovering your mouse over an item in the plan, you can see detailed information for that part of the query. You can see this in Figure 23.3.
Figure 23.3. Viewing a SQL Server execution plan.
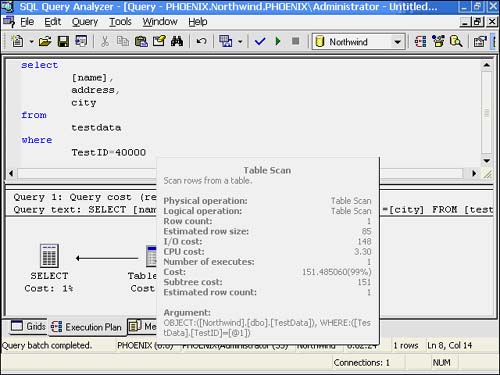
In this instance, the query is spending almost all of its time performing a table scan. This usually means that there is a problem with a table's index. Fortunately, the Query Analyzer can help us fix those as well.
Analyzing Table Indexes
Follow these steps to have the Query Analyzer examine the indexes of a table.
-
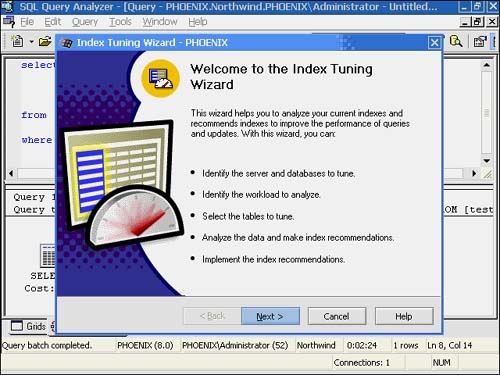
Choose the Query menu again and select the Index Tuning Wizard. Click Next in the introductory screen that loads (shown in Figure 23.4).
Figure 23.4. The Index Tuning Wizard.
-
Accept all defaults on the next two screens you're prompted with by clicking Next.
-
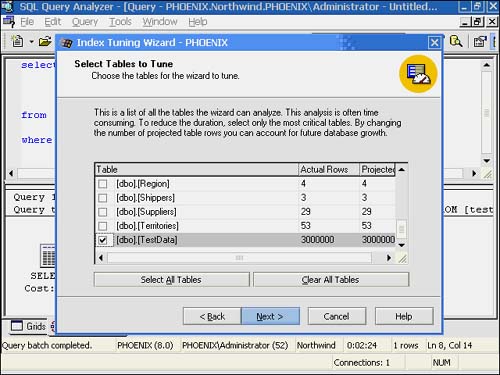
As shown in Figure 23.5, the wizard then prompts you to select the tables you would like to tune. Check the box to the left of "TestData" and select Next. The Index Tuning Wizard then analyzes the table.
Figure 23.5. Choosing a table to analyze.
After the Index Tuning Wizard is done analyzing a table, it will load a list of recommendations. Accept all recommendations by clicking Finish, and then rerun the earlier query. It should perform significantly faster than last time.
| for RuBoard |
EAN: 2147483647
Pages: 237
- Chapter IV How Consumers Think About Interactive Aspects of Web Advertising
- Chapter VII Objective and Perceived Complexity and Their Impacts on Internet Communication
- Chapter IX Extrinsic Plus Intrinsic Human Factors Influencing the Web Usage
- Chapter XII Web Design and E-Commerce
- Chapter XVI Turning Web Surfers into Loyal Customers: Cognitive Lock-In Through Interface Design and Web Site Usability