15.2 OTHER MEASUREMENT-BASED TECHNIQUES
|
| < Day Day Up > |
|
15.2 OTHER MEASUREMENT-BASED TECHNIQUES
Having looked at some relatively large-scale trends I now intend to shift the focus to look at some specific techniques that have not yet caught the attention of the metrics community in general but which, in my view, have considerable potential for the future. Within this chapter it will not be practical to describe these measurement-based techniques in full and I see these descriptions as more of a taster. If further information is required, references are provided within the bibliography.
I would first like to look at a technique known as Data Envelopment Analysis (DEA), an extremely intimidating name for something that is inherently elegant and practical. DEA is a development of the mathematical technique known as Linear Programming and it is used in the following way.
Imagine the situation where you have identified two characteristics of your process or products that are common across the organization, for example you may consider productivity and reliability. Further imagine that you have measures associated with these characteristics and you have collected data from a number of projects. Now, what many managers want to know is how these different projects have performed in terms of these two characteristics.
One thing that you may consider doing is to present a graph with productivity as the x axis and reliability as the y axis. So, the performance of each project can be described in terms of two-dimensional vector coordinates. This is all very well, but managers often want information in non-graphical form. They also like comparisons against "best in class." Within the DEA technique these requirements are met by identifying the boundary cases and using these to describe an envelope around the set of observations. For any particular project, its performance can then be represented by drawing a vector from the origin, through the project point to the boundary.
Performance is then expressed as a ratio of the distance from the origin to the project point compared to the total length of the vector to the boundary. This is shown in Figure 15.2:
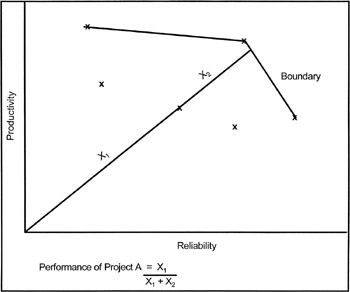
Figure 15.2: Performance
The great beauty of DEA is that the technique can be applied to more dimensions than two; in fact, to any number subject to the computational capabilities available to you. DEA has been used in the United States to compare educational establishments and is also being used now within the IT industry. Tool support is also available.
For more information about DEA please see Elam (1) and Charnes (1) .
I would like to close this chapter by considering an aspect of Software Metrics that is often considered but seldom actioned, which is a great pity because its impact could be huge. The area I refer to is that known as the soft, or environmental, factors.
Soft Factors are all to do with the people aspects of software engineering; in fact another way of referring to this topic is "peopleware" and there is an excellent book by Tom DeMarco and Tim Lister that bears this title, DeMarco (1) . One reason that this topic gets such little attention is because of managers' reaction to it. So
often you find that managers see any initiative in this area as one that will lead to demands for more money, bigger offices, more desk space, etc., yet soft factors go much further than this.
There is, of course, another point to consider. If you were a manager and it was proved, beyond reasonable doubt, that giving your staff more of something would increase quality and productivity to such an extent that the cost of giving would be more than outweighed by the return, what would you do?
The sad situation in the vast majority of organizations today is that the information to assess the payback from improved environments is not even collected. Even worse, we know that some teams perform well in adverse conditions while others cannot perform adequately even when everything is going right. Why is this? What, for example, is the effect of team composition in terms of experience, age, even gender?. What size of team is the optimum within your environment? When did you last attempt to discover the morale level of your team other than by listening in on the grapevine?
Yet there are organizations that do apply management principles to the soft factors, although they are few and far between, and who seem to be getting good results. IBM did invest heavily in one installation specifically designing it to provide an office environment that was wanted by the workforce. One reference at the time claimed a 30% higher productivity rate than that found in other sites doing similar work, McCue (1) .
A problem with Soft Factors is the question of data collection so I would like to describe one experiment that I was involved in that gave limited but promising results in that area.
The purpose of our experiment was really to see if data could be collected rather than to try to assess specific soft-factor impact but we did get some interesting results as you will see.
Our first problem, of course, was what to actually collect. There are very many potential soft factors about which data could be collected but this leads to a classic "data hunter" scenario and we felt that should be avoided. The approach adopted was quite simplistic but seemed to work. A colleague and I sat down together and, over the course of a day, brainstormed out a whole raft of potential factors. All the classics were in there such as experience of team, availability of terminals and compiler speeds. There were a few others that crept in from the dark, for example the gender mix of the team. Is this a valid soft factor, in other words could the gender mix within a team affect performance in any way? When venturing into this area one can only depend upon personnel experience, so I can only talk for all male teams and the mixed variety. What I have found is that mixed-gender teams tend to work better than single-gender teams, although I freely admit that this is a subjective opinion. However, why might that be the case.
First, I believe that the broader range of interests commonly found in mixed gender teams acts to increase team cohesion. An all-male team can easily get caught up in, say, the world cup to the extent that work suffers. Second, and perhaps this is the real reason such teams work, I find that people in mixed gender teams are more polite to each other than in all-male teams. This is merely an observation but I will also state that politeness is, in my opinion, the oil that lubricates the social machine. Perhaps such lubrication helps to improve performance in teams as well as in engines.
I include the discussion on mixed gender teams to show that we did give some thought to the various factors that we were considering at that point. Some we really had some fun with!
But we then had a problem in that we were suffering from an plenitude of riches! We had some sixty or seventy soft factors identified and we knew that we could not collect, or use, data on so many. To reduce the set we ran a limited survey. We circulated our list of soft factors to a number of experienced software engineers and managers and we asked them to score the factors in terms of impact on performance. This was a subjective assessment based on their experience. This was where we had our first interesting result. Because of the way the organization was structured at the time we were able to include representatives from an American plant in the survey as well as individuals from the United Kingdom.
Not only did the two groups identify the same set of factors as most important, the importance given to each critical factor (judged by the percentage ranking it as critical rather than merely important), were also almost identical. This went against the perceived wisdom that said there were significant differences between the U.S. and UK environment and came as a surprise to us. Basically it seemed to suggest that we were operating with the same value system. This was an interesting result, but not one that would "stand up in court." Our sample size was too small, our analysis fairly simplistic. We got what we wanted from the exercise but we did not believe that it could go any further at that time. The gender mix in teams did not survive, either!
By means of this survey we were able to reduce our initial set of factors down to about thirty. The next step was to come up with some way to measure those factors. Now, I wish that I could tell you that we came up with. some wonderful new measurement technique but the reality is that we gathered data on almost all of those factors by means of a good old-fashioned questionnaire. There were only two factors about which we could collect data from some other source: the experience in the industry and the experience within the organization of team members. This data was available from the personnel department, but in the end we asked the pilot group directly anyway.
Which brings us to the next part of the exercise, the pilot. We were lucky enough to have the cooperation of a very helpful group within the organization and they had a six month enhancement project starting at just about the right time. We spent some time with this team explaining what we were after and why. We identified a specific individual to coordinate things within that team and off we went!
The approach was relatively straightforward. Some of the factors we had identified as potentially critical to performance lay within the domain of the project manager, for example information regarding promotions was most easily obtained from the project manager, while some factors concerned the whole team. A third subset of factors also lay with the project manager and were unlikely to change much over short periods of time. To cover these three areas we set up the following mechanisms. First, the project manager completed a questionnaire at the end of each month. Second, all team members completed a different questionnaire monthly. These were anonymous. Third, the project manager was interviewed at the beginning, the midpoint and the end of the project.
We completed the experiment by reporting to our own management, by analyzing the collected data and by feeding back to the pilot group. What did we find out?
Remember that the purpose of the experiment was to test the feasibility of such a data collection exercise and we were pleased to learn that nobody in the pilot group felt that it was intrusive. The actual cost for the team questionnaires was about ten minutes per person per month. An extremely satisfying result was that the project team response to the exercise was very positive.
They felt that such a mechanism gave them a chance to influence their own environment, which does not simply mean bigger desks, and also gave them a chance to report things that were good as well as drawing attention to things that were bad. Certain changes were needed to the questionnaires and we realized that the administration of the exercise would need to be improved, but overall the results were positive. We could collect that kind of data.
We also got a couple more interesting results. One of the soft factors identified was awareness of the local development process so we asked our team members whether or not they felt familiar with that process. Almost invariably the answer was 'yes.' At the end of the pilot we introduced the team to process modeling notations such as those used elsewhere in this book and asked them to draw out their own view of the development process. The results were interesting, and varied! Even allowing for the fact that different team members were involved with different viewpoints, different processes were described there. So much for common understanding of the process being used.
The other interesting result was that during the course of our pilot a number of individuals were made redundant in a completely different part of the organization. While this did not directly affect our group you would expect morale to be affected. Not surprisingly, our morale indicators did register a significant drop for that month. The surprising thing, if our indicators could be believed and we would not claim that they were anything but coarse, was that morale returned to its normal level by the end of the next month.
We found the results of this experiment very encouraging. What was not so encouraging was the brick wall we then ran into. It was obvious to us and to our immediate management team that there was merit in establishing mechanisms to collect this type of data across a large part of the organization but it was also a political bombshell and would have to be handled with great care. While we did map out a strategy for achieving implementation of our proposals, the politicking, marketing and effort involved would have cost multiples of the original experiment. Sadly we had other priorities.
This is typical of many areas in Software Metrics, and for process improvement in general, that simple techniques that could genuinely be used to make things better for all concerned, including managers, become political footballs within the organization. Fortunately, there are some individuals working within these organizations that can and do play the political game and who also recognize the worth of techniques such as those mentioned in this chapter. Very occasionally such individuals reach the upper echelons of power. When that happens the impact is large and far reaching.
|
| < Day Day Up > |
|
EAN: 2147483647
Pages: 151