 | Note: Large images and tables on this page may necessitate printing in landscape mode.
Copyright 2007 The McGraw-Hill Companies. All rights reserved.
Clinician's Pocket Reference > Chapter 19. Basic ECG Reading >
Basic ECG Reading: Introduction The formal procedure for obtaining an ECG is given in Chapter 13, Electrocardiogram. Every ECG should be approached in a systematic, stepwise way. Many automated ECG machines can give a preliminary interpretation of a tracing; however, all automated interpretations require analysis and sign-off by a physician. Determine each of the following: - Standardization. With the ECG machine set on 1 mV, a 10-mm standardization mark (0.1 mV/mm) is evident (Figure 19 1).
- Axis. If the QRS is upright (more positive than negative) in leads I and aVF, the axis is normal. The normal axis range is 30 degrees to +105 degrees.
- Intervals. Determine the PR, QRS, and QT intervals (Figure 19 2). Intervals are measured in the limb leads. The PR should be 0.12 0.20 s, and the QRS, < 0.12 s. The QT interval increases with decreasing heart rate, usually < 0.44 s. The QT interval usually does not exceed one half of the RR interval (the distance between two R waves).
- Rate. Count the number of QRS cycles on a 6-s strip and multiply that number by 10 to roughly estimate the rate. If the rhythm is regular, you can be more exact in determining the rate by dividing 300 by the number of 0.20-s intervals (usually depicted by darker shading) and then extrapolating for any fraction of a 0.20-s segment.
- Rhythm. Determine whether each QRS is preceded by a P wave, look for variation in the PR interval and RR interval (the duration between two QRS cycles), and look for ectopic beats.
- Hypertrophy. One way to detect LVH is to calculate the sum of the S wave in V1 or V2 plus the R wave in V5 or V6. A sum > 35 indicates LVH. Some other criteria for LVH are R > 11 mm in aVL or R in I + S in III > 25 mm.
- Infarction or Ischemia. Check for ST-segment elevation or depression, Q waves, inverted T waves, and poor R-wave progression in the precordial leads (see Myocardial Infarction).
| 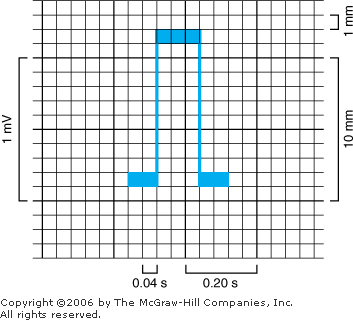 | Examples of 10-mm standardization mark and time marks and standard ECG paper running at 25 mm/s. |
|
| 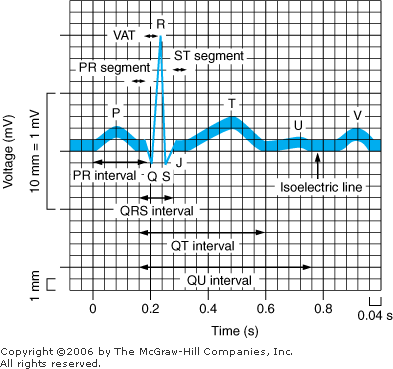 | Diagram of the ECG complexes, intervals, and segments. The U wave is normally not well seen. |
|
|
Basic Information Equipment Bipolar Leads - Lead I: Left arm to right arm
- Lead II: Left leg to right arm
- Lead III: Left leg to left arm
Precordial Leads: V1 to V6 across the chest (see Figure 13 9). ECG Paper: With the ECG machine set at 25 mm/s, each small box represents 0.04 s, and each large box 0.2 s (see Figure 19 1). Most ECG machines automatically print a standardization mark. Normal ECG Complex Note: A small amplitude in the Q, R, or S wave is represented by a lowercase letter. A large amplitude is represented by an uppercase letter. The pattern shown in Figure 19 2 can also be noted qRs. - P Wave. Caused by depolarization of the atria. With normal sinus rhythm, the P wave is upright in leads I, II, aVF, V4, V5, and V6 and inverted in aVR.
- QRS Complex. Represents ventricular depolarization
- Q Wave. The first negative deflection of the QRS complex (not always present and, if present, may be pathologic). To be significant, the Q wave should be > 25% of the QRS complex.
- R Wave. The first positive deflection that sometimes occurs after the S wave
- S Wave. The negative deflection following the R wave
- T Wave. Caused by repolarization of the ventricles and follows the QRS complex, normally upright in leads I, II, V3, V4, V5, and V6 and inverted in aVR
|
Axis Deviation Axis represents the sum of the vectors of the electrical depolarization of the ventricles and gives an idea of the electrical orientation of the heart in the body. In a healthy person, the axis is downward and to the left (Figure 19 3). The QRS axis is midway between two leads that have QRS complexes of equal amplitude, or the axis is 90 degrees to the lead in which the QRS is isoelectric (ie, R amplitude wave equals S-wave amplitude). | 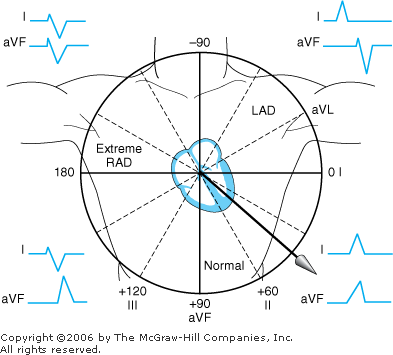 | Graphic representation of axis deviation. ECG representations of each type of axis are shown in each quadrant. Large arrow indicates normal axis. |
|
- Normal Axis. QRS positive in I and aVF (0 90 degrees). Normal axis is actually 30 to 105 degrees.
- Left Axis Deviation (LAD). QRS positive in I and negative in aVF, 30 to 90 degrees
- Right Axis Deviation (RAD). QRS negative in I and positive in aVF, +105 to +180 degrees
- Extreme RAD. QRS negative in I and negative in aVF, +180 to +270 or 90 to 180 degrees
Clinical Correlations - RAD. Seen with RVH, RBBB, COPD, and acute PE (a sudden change in axis toward the right) and occasionally in healthy persons
- LAD. Seen with LVH, LAHB ( 45 to 90 degrees), LBBB, and in some healthy persons
|
Heart Rate Bradycardia: Heart rate < 50 beats/min Tachycardia: Heart rate > 100 beats/min Rate Determination: Figure 19 4, below - Method 1. Note the 3-s marks along the top or bottom of the ECG paper (15 large squares). The approximate rate equals the number of cycles (ie, QRSs) in a 6-s strip x 10.
- Method 2 (for regular rhythms). Count the number of large squares (0.2-s boxes) between two successive cycles. The rate equals 300 divided by the number of squares. Extrapolate if the QRS complex does not fall exactly on the 0.2-s marks (eg, if each QRS complex is separated by 2.4 0.20-s segments, the rate is 120 beats/min. The rate between two 0.20-s segments is 150 beats/min, and between three 0.20-s segments is 100 beats/min). Each of the five smaller 0.04-s marks between the second and third 0.20 mark would be 10 beats/min (150 100 = 50 5). Because the rate is three of the 0.04-s marks from the third 0.20-s segment, the rate is 100 + 30, or 130 beats/min. Remember that the number of beats per minute for each 0.04-s mark varies depending on which two 0.20 marks they are associated with (eg, between the fifth and sixth 0.20-s mark each 0.04 mark is 2 beats/min).
|  | Sample strip for rapid rate determination. In method 1, estimate the rate by counting the number of beats (eight) in two 3-s intervals. The rate is 8 x 10, or 80 beats/min (method 1). In method 2, each beat is separated from the next by four 0.20-s intervals, so divide 300 by 4, and the rate is 75 beats/min. Because the beats are separated by exactly four beats, extrapolation is not necessary. |
|
|
Rhythm Sinus Rhythms Normal: Each QRS preceded by a P wave (which is positive in II and negative in aVR) with a regular PR and RR interval and a rate between 60 and 100 beats/min (Figure 19 5) |  | Normal sinus rhythm. |
|
Sinus Tachycardia: Normal sinus rhythm with a heart rate > 100 beats/min and < 180 beats/min (Figure 19 6) |  | Sinus tachycardia. The rate is 120 130 beats/min. |
|
Clinical Correlations. Anxiety, exertion, pain, fever, hypoxia, hypotension, increased sympathetic tone (secondary to drugs with adrenergic effects [eg, epinephrine]), anticholinergic effect (eg, atropine), PE, COPD, AMI, CHF, hyperthyroidism, and others Sinus Bradycardia: Normal sinus rhythm with heart rate < 50 beats/min (Figure 19 7) |  | Sinus bradycardia. Rate is approximately 38 beats/min. |
|
Clinical Correlations. Well-trained athlete, normal variant, secondary to medications (eg, beta-blockers, digitalis, clonidine, nondihydropyridine calcium channel blockers [verapamil, diltiazem]), hypothyroidism, hypothermia, sick sinus syndrome (tachy brady syndrome), and others Treatment - If asymptomatic (good urine output, adequate BP, and normal sensorium), no treatment.
- If hypotension , support blood pressure
Sinus Arrhythmia: Normal sinus rhythm with irregular heart rate. Inspiration causes a slight increase in rate; expiration decreases rate. Normal variation between inspiration and expiration is 10% or less. Atrial Arrhythmias PAC: Ectopic atrial focus firing prematurely followed by a normal QRS (Figure 19 8, below). The compensatory pause following the PAC is partial; the RR interval between beats 4 and 6 is less than between beats 1 and 3 and beats 6 and 8. |  | Premature atrial contraction (PAC). Fifth beat is PAC. |
|
Clinical Correlations. Usually no clinical significance; caused by stress, caffeine, and myocardial disease PAT: A run of three or more consecutive PACs. The rate is usually 140 250 beats/min. The P wave may not be visible, but the RR interval is very regular (Figure 19 9). Falls under the more general category of supraventricular tachycardia (SVT) because it is indistinguishable from AV nodal reentry tachycardia (AVNRT) and paroxysmal junctional tachycardia and the treatments are similar. | 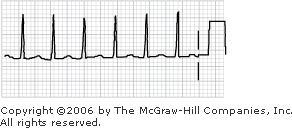 | Paroxysmal atrial tachycardia. |
|
Clinical Correlations. Some healthy persons; heart disease. Symptoms: palpitations, light-headedness, and syncope Treatment - Increase Vagal Tone. Valsalva maneuver or carotid massage
- Medical Treatment. Can include adenosine, verapamil, digoxin, edrophonium, or beta-blockers (propranolol, metoprolol, esmolol). Use verapamil and beta-blockers cautiously at the same time because asystole can occur.
- Cardioversion with Synchronized DC Shock. Particularly in patients in hemodynamically unstable condition (see Chapter 21, Automatic External Defibrillation, Defibrillation, and Cardioversion)
MAT: Originates from ectopic atrial foci; characterized by varying P-wave morphology and PR interval and irregular (Figure 19 10). |  | Multifocal atrial tachycardia. |
|
Clinical Correlations. COPD, advanced age, CHF, diabetes, and theophylline use. Antiarrhythmics are often ineffective. Manage the underlying disease. AFib: Irregularly irregular rhythm, no discernible P waves. Ventricular rate varies 100 180 beats/min (Figure 19 11). The ventricular response may be < 100 beats/min if the patient is taking digoxin, verapamil, or a beta-blocker or has AV nodal disease. | 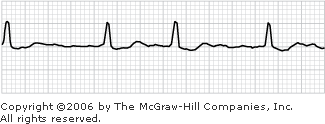 | Atrial fibrillation. |
|
Clinical Correlations. Some healthy persons; organic heart disease (CAD, hypertensive heart disease, valve disease), thyrotoxicosis, alcohol abuse, pericarditis, PE, and postoperative state Treatment - Pharmacologic Therapy. IV adenosine, verapamil, diltiazem, digoxin, and beta-blockers (propranolol, metoprolol, esmolol) can be used to slow the ventricular response. Quinidine, procainamide, propafenone, ibutilide, and amiodarone can be used to maintain or convert to sinus rhythm (see individual agents in Chapter 21, Emergencies)
- DC-Synchronized Cardioversion. If associated with increased myocardial ischemia, hypotension, or pulmonary edema (see Chapter 21, Automatic External Defibrillation, Defibrillation, and Cardioversion)
Atrial Flutter: Sawtooth flutter waves with an atrial rate of 250 350 beats/min; rate may be regular or irregular depending on whether the atrial impulses are conducted through the AV node at a regular interval or at a variable interval (Figure 19 12). |  | Atrial flutter with varying atrioventricular (AV) block (3:1 to 5:1 conduction). |
|
Example: One ventricular contraction (QRS) for every two flutter waves = 2:1 flutter. A flutter wave is buried within each QRS complex so if you see two flutter waves before each QRS complex, that is 3:1 flutter; one flutter wave before each QRS complex is 2:1 flutter (the second flutter is hidden in the QRS complex or the T-wave). Clinical Correlations. Valvular heart disease, pericarditis, ischemic heart disease; pulmonary disease, including PE; alcohol abuse Treatment. Do not use quinidine or procainamide (atrial conduction may decrease to the point where 1:1 atrial to ventricular conduction can occur, and the ventricular rate increases and causes hemodynamic compromise); otherwise, similar to management of atrial fibrillation. Ibutilide (class III antiarrhythmic) or radiofrequency ablation Nodal Rhythm AV Junctional or Nodal Rhythm: Rhythm originates in the AV node. Associated with retrograde P waves that precede or follow the QRS. If the P wave is present, it is negative in lead II and positive in aVR (opposite of normal sinus rhythm) (Figure 19 13). Three or more premature junctional beats in a row constitute junctional tachycardia, which has the same clinical significance as PAT. |  | Junctional rhythm with retrograde P waves (inverted) following QRS complex. |
|
Ventricular Arrhythmias PVC: A premature beat arising in the ventricle. P waves may be present but have no relation to the QRS of the PVC. The QRS is usually > 0.12 s with an LBBB pattern. A compensatory pause follows a PVC that is usually longer than after a PAC (Figure 19 14). The RR interval between beats 2 and 4 is equal to that between beats 4 and 6. Thus the pause following the PVC (the third beat) is fully compensatory. The following patterns are recognized: - Bigeminy. One normal sinus beat followed by one PVC in an alternating manner (Figure 19 15)
- Trigeminy. Sequence of two normal beats followed by one PVC
- Unifocal PVCs. Arise from one site in the ventricle. Each has the same configuration in a single lead (see Figure 19 14).
- Multifocal PVCs. Arise from different sites and therefore have various shapes (Figure 19 16)
|  | Premature ventricular contractions (PVCs). Third and seventh beats are PVCs. |
|
|  | Ventricular bigeminy. |
|
| 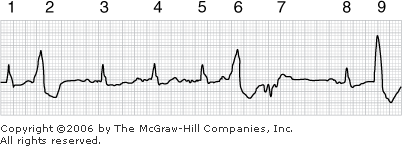 | Multifocal PVCs. Second, sixth, and seventh beats are PVCs. Second and sixth PVCs have the same morphology. |
|
Clinical Correlations. Healthy persons; excessive caffeine ingestion, anemia, anxiety; organic heart disease (ischemic, valvular, or hypertensive); medications (epinephrine and isoproterenol; digitalis and theophylline toxicity); predisposing metabolic abnormalities (hypoxia, hypokalemia, acidosis, alkalosis, hypomagnesemia) Criteria for Treatment. - No treatment if asymptomatic. Studies have shown increased mortality among patients treated for PVCs; however, > 10 PVCs per hour does increase death risk in patients with heart disease.
- If symptomatic, beta-blockers. Radiofrequency ablation for right ventricular outflow tract (RVOT) tachycardia in structurally normal hearts.
Ventricular Tachycardia: Three or more PVCs in a row (Figure 19 17). A wide QRS usually with an LBBB pattern (vs narrow complex seen with supraventricular tachycardia). May occur as short paroxysm or sustained run (> 30 s) with rate of 120 250 beats/min. Can be life-threatening (hypotension and degeneration into ventricular fibrillation). Management of nonsustained ventricular tachycardia is controversial. |  | Ventricular tachycardia. |
|
Clinical Correlations. See PVCs. Patients with ventricular aneurysm are more susceptible to arrhythmias, especially in the presence of cardiac disease. Treatment. See Chapter 21, Automatic External Defibrillation, Defibrillation, and Cardioversion. Ventricular Fibrillation: Erratic electrical activity from the ventricles, which fibrillate or twitch asynchronously; no cardiac output (Figure 19 18). |  | Ventricular fibrillation. |
|
Clinical Correlations. One of two patterns seen with cardiac arrest (the other is asystole/flat line) Treatment. See Chapter 21, Automatic External Defibrillation, Defibrillation, and Cardioversion. Heart Block First-Degree Block: PR interval > 0.2 s (or five small boxes). Usually not clinically significant (Figure 19 19). Caused by drugs (beta-blockers, digitalis, calcium channel blockers) |  | First-degree AV block. PR interval is 0.26 s. |
|
Second-Degree Block Mobitz Type I (Wenckebach). Progressive prolongation of PR interval until P wave is blocked and not followed by a QRS complex (Figure 19 20). Can occur as a 2:1, 3:2, or 4:3 block. The ratio of the atrial to ventricular beats can vary. With 4:3 block, every fourth P wave is not followed by a QRS. |  | Second-degree AV block, Mobitz type I (Wenckebach) with 4:3 conduction. |
|
Clinical Correlations. Acute myocardial ischemia such as inferior MI, ASD, valvular heart disease, rheumatic fever, and digitalis or propranolol toxicity. Can be transient or rarely progress to life-threatening bradycardia. Treatment. Usually expectant; if bradycardia occurs: atropine, isoproterenol, or a pacemaker Mobitz Type II. A series of P waves with conducted QRS complexes followed by a nonconducted P wave. The PR interval for the conducted beats remains constant. Can occur as 2:1, 3:2, or 4:3 block. The ratio of the atrial to ventricular beats can vary. With 4:3 block, every fourth P wave is not followed by a QRS. (Note: 2:1 AV block can be either Mobitz type I or Mobitz type II, which can be difficult to differentiate. Mobitz I has a prolonged PR with a narrow QRS; Mobitz II has a normal PR interval with an LBBB pattern [wide QRS]). Clinical Correlations. Implies severe conduction system disease that can progress to complete heart block; acute anterior MI and cardiomyopathy Treatment. Temporary cardiac pacemaker, particularly when associated with acute anterior MI Third-Degree Block: Complete AV block with independent atrial and ventricular rates. The ventricular rate is usually 20 40 beats/min (Figure 19 21). |  | Third-degree AV block (complete heart block). Atrial rate is 100 beats/min; ventricular rate is 57 beats/min. |
|
Clinical Correlations. Degenerative changes in conduction system in elderly persons, digitalis toxicity, transient finding with an acute inferior MI (ischemia of the AV junction), aftermath of acute anterior MI (higher probability of mortality than after inferior MI); can result in syncope or CHF Treatment. Placement of a temporary or permanent pacemaker BBB: Complete BBB is present when the QRS complex is > 0.12 s (or three small boxes on the ECG). Look at leads I, V1, and V6. Degenerative changes and ischemic heart disease are the most common causes. RBBB: The RSR pattern seen in V1, V2, or both. Also a wide S in leads I and V6 (Figure 19 22) |  | Leads I, V1, and V6 show right bundle branch block (RBBB) pattern. |
|
Clinical Correlations. Healthy persons; diseases affecting the right side of the heart (pulmonary hypertension, ASD, ischemia); sudden onset associated with PE and acute exacerbation of COPD LBBB: RR' in leads I, V6, or both. QRS complex may be more slurred than double-peaked as in RBBB. A wide S wave is seen in V1 (Figure 19 23). |  | Leads I, V1, and V6 show left bundle branch block (LBBB) pattern. |
|
Clinical Correlations. Organic heart disease (hypertensive, valvular, and ischemic), severe aortic stenosis. New LBBB after AMI can be an indication for inserting a temporary cardiac pacemaker. Consider new LBBB MI until proven otherwise. |
Cardiac Hypertrophy Atrial Hypertrophy P wave > 2.5 mm in height and > 0.12 s wide (three small boxes on the ECG) RAE: Tall (> 2.5 mm), slender, peaked P waves (P pulmonale pattern) in leads II, III, aVF (Figure 19 24). Tall (> 1.5 mm) P may be present in V1 and V2. | 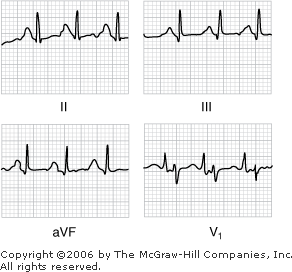 | Right atrial enlargement, leads II, III, aVF, and V1. Note tall P waves in II, III, and aVF and tall, slender P waves in V1. |
|
Clinical Correlations. Chronic diffuse pulmonary disease, pulmonary hypertension, congenital heart disease (ASD) LAE: Notched P wave (P mitrale pattern) in leads I and II. Wide ( 0.11 s), slurred biphasic P in V1 with wider terminal than initial component (negative deflection) (Figure 19 25) 0.11 s), slurred biphasic P in V1 with wider terminal than initial component (negative deflection) (Figure 19 25) | 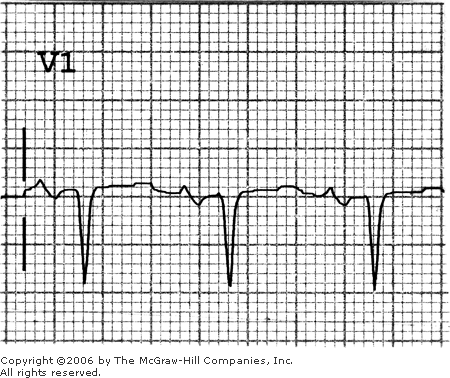 | Left atrial enlargement. |
|
Clinical Correlations. Mitral stenosis or mitral regurgitation or secondary to LVH with hypertensive cardiovascular disease Ventricular Hypertrophy RVH: Tall R wave in V1 (R wave > S wave in V1), persistent S waves in V5 and V6, progressively smaller R wave from V1 to V6, slightly widened QRS intervals (Figure 19 26), and strain pattern with ST-segment depression and T-wave inversion in V1 to V3. Pattern of small R waves with relatively large S waves in V1 to V6 may be present. Right axis deviation (> 105 degrees) invariably present. | 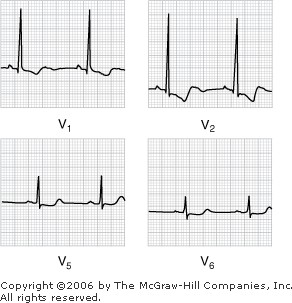 | Right ventricular hypertrophy, leads V1, V2, V5, and V6. Note the tall R waves in V1 and V2, greater than the R waves in V5 and V6. Also note strain pattern in V1 and V2 with down-sloping ST-segment depression and T-wave inversion. |
|
Clinical Correlations. Mitral stenosis, chronic diffuse pulmonary disease, chronic recurrent PE, congenital heart disease (eg, tetralogy of Fallot), Duchenne muscular dystrophy, biventricular hypertrophy (LVH and RVH, LVH findings often predominating) LVH: Voltage criteria (> age 35 y): S wave in V1 or V2 plus R wave in V5 or V6 > 35 mm, or R wave in aVL > 11 mm or R wave in I + S wave in III > 25 mm, or R wave in V5 or V6 > 26 mm. QRS complex may be > 0.10 s wide in V5 or V6. ST-depression and T-wave inversion in anterolateral leads (I, aVL, V5 or V6) suggest LVH with strain (Figure 19 27) | 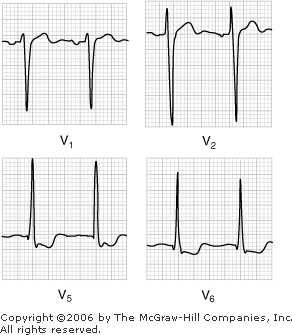 | Left ventricular hypertrophy, leads V1, V2, V5, and V6. S wave in V2 + R wave in V5 is 55 mm. Note ST changes and T-wave inversion in V5 and V6, suggesting strain. |
|
Clinical Correlations. HTN, aortic stenosis, aortic insufficiency, long-standing CAD, some forms of congenital heart disease |
Myocardial Infarction (See also Chapter 21, Acute Coronary Syndrome and Myocardial Infarction.) Myocardial Ischemia: Inadequate myocardial oxygen supply (coronary artery blockage or spasm). The ECG can show ST-segment depression (subendocardial ischemia) (Figure 19 28), ST elevation (transmural ischemia) (Figure 19 29), or symmetrically inverted (flipped) T waves (Figure 19 30) in the area of ischemia (eg, inferior ischemia in II, III, and F; anterior ischemia in V1 to V6; lateral ischemia in I, aVL; anterolateral ischemia in I, aVL, V5, and V6; anteroseptal ischemia in V1, V2, V3, and V4. | 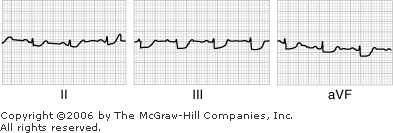 | ST segment depression in leads II, III, and aVF in a patient with acute subendocardial ischemia and infarction. |
|
| 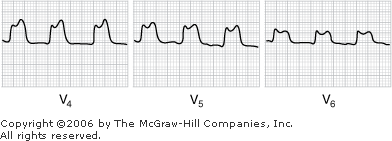 | ST elevation in leads V4, V5, and V6 in a patient with acute anterolateral ischemia. |
|
| 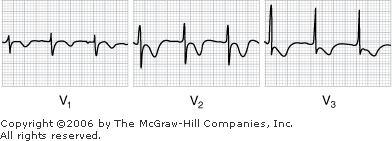 | Inverted T waves. |
|
MI: Myocardial necrosis caused by severe ischemia. Can be transmural MI (ST elevation early, T-wave inversion, Q waves late) or subendocardial MI (ST depression, T-wave inversion without evidence of Q waves). Table 19 1, below, outlines the localization of MIs. - Acute Injury Phase (transmural). Hyperacute T waves, then ST-segment elevation. Hyperacute T waves return to normal in minutes to hours. ST elevation usually regresses after hours to days. Persistent ST elevation suggests a left ventricular aneurysm.
- Evolving Phase (transmural). Hours to days after MI. Deep T-wave inversion occurs and then replaces ST-segment elevation, and T wave may return to normal.
- Q Waves (transmural). Hours to days after transmural MI, a Q wave is the initial negative deflection of the QRS complex. A significant Q wave is 0.04 s in duration and > 25% the height of the R wave (Figure 19 31). May regress to normal after years.
Table 19 1 Localization of Transmural Myocardial Infarction on ECG
|
| | Location of MI | Presence of Q Wave or ST-Segment Elevation | Reciprocal ST Depression |
|---|
| Anterior | V1 to V6 (or poor R-wave progression in leads V1 to V6)a
| II, III, aVF | | Lateral | I, aVL, V5, V6 | V1, V3
| | Inferior | II, III, aVF | I, aVL, possibly anterior leads | | Posterior | Abnormally tall R and T waves in V1 to V3
| V1 to V3
| | Subendocardial | No abnormal Q wave. ST-segment depression in the anterior, lateral, or inferior leads | |
|
aNormally in V1 to V6, the R-wave amplitude gradually increases and the S wave decreases with a "biphasic" QRS (R = S) in V3 or V4. With an anterior MI, there will be a loss of R-wave voltage (instead of Q waves) and the biphasic QRS will appear more laterally in V4 to V6, hence the term poor R-wave progression. |
| 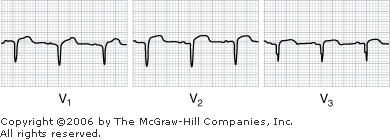 | Q waves in leads V1, V2, and V3 in a patient with acute anteroseptal MI. Note ST elevation to determine acute nature of infarction. |
|
|
Electrolyte and Drug Effects Electrolytes Hyperkalemia: Narrow, symmetrical, diffuse, peaked T waves. In severe hyperkalemia, PR prolongation occurs, the P wave flattens and is lost, and the QRS widens and can progress to ventricular fibrillation (Figure 19 32). | 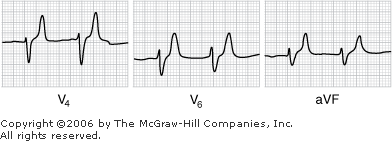 | Diffuse tall T waves in leads V4, V6, and aVF with widened QRS and junctional rhythm (loss of P waves) secondary to hyperkalemia. |
|
Hypokalemia: ST-segment depression with the appearance of U waves (positive deflection after the T wave) (Figure 19 33) | 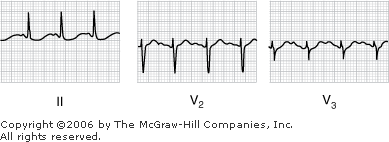 | Leads II, V2, and V3 in a patient with hypokalemia. A U wave is easily seen in V2 and V3 but difficult to distinguish from the T wave in II. |
|
Hypercalcemia: Short QT interval Hypocalcemia: Prolonged QT interval Drugs Digitalis Effect: Down-sloping ST segment Digitalis Toxicity - Arrhythmias. PVCs, bigeminy, trigeminy, ventricular tachycardia, ventricular fibrillation, PAT, nodal rhythms, accelerated junctional tachycardia and sinus bradycardia
- Conduction Abnormalities. First-degree, second-degree, and third-degree heart blocks
Quinidine and Procainamide: With toxic levels, prolonged QT, flattened T wave, and QRS widening |
Miscellaneous ECG Changes Pericarditis: Diffuse ST elevation concave upward, diffuse PR depression, diffuse T-wave inversion, or a combination of these findings (Figure 19 34) | 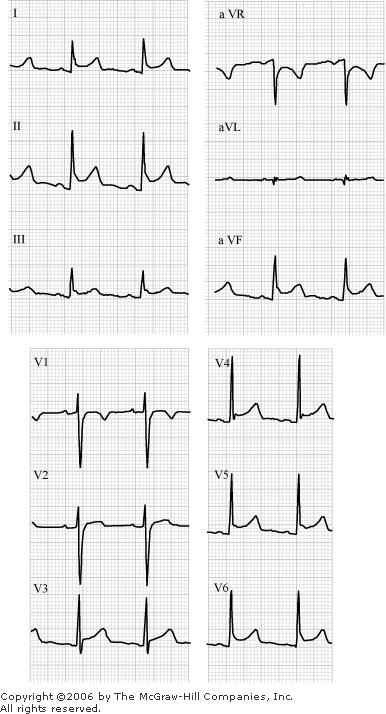 | Acute pericarditis. |
|
Clinical Correlations. Idiopathic conditions; viral, bacterial, and fungal infections, such as TB; AMI, postpericardiotomy syndrome, Dressler syndrome; collagen vascular diseases; uremia; cancer Hypothermia: Sinus bradycardia, AV junctional rhythm, ventricular fibrillation. Classically, J point (the end of the QRS complex and the beginning of the ST segment) elevation, intraventricular conduction delay, and prolonged QT interval possible (Figure 19 35). Known as an Osborne wave. | 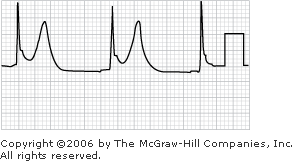 | Sinus bradycardia, Osborne wave. J-point elevation with ST-segment elevation and prolonged QT interval (0.56 s) in patient with hypothermia. |
|
WPW Pattern and Syndrome: The WPW (Wolff Parkinson White) pattern is a short PR interval along with a delta wave (a delay in initial deflection of the QRS complex) on the ECG (Figure 19 36). WPW syndrome is the WPW pattern on ECG and documented tachyarrhythmias, usually SVT or Afib. Tachyarrhythmia (preexcitation syndrome) due to conduction from the SA node to the ventricle through an accessory pathway that bypasses the AV node (bundle of Kent). | 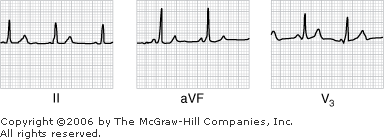 | Short PR interval and delta waves in leads II, aVF, and V3 in a patient with Wolff Parkinson White syndrome. |
|
|
| |  |