Creating Windows Media Files
After the wiring is complete, the technicians can test the suite by capturing and creating a Windows Media file. They will use the two-step capturing method because it will work with high-bit-rate content, which pushes the capabilities of the system. First, the technicians will capture an uncompressed AVI file, and then they will compress and encode the file to a Windows Media file that plays back at 100 Kbps.
Configuring Playback on the Digital Betacam
The basic operation of a Digital Betacam deck is not much different from that of a consumer S-VHS machine. The main difference is that a Betacam deck enables you to adjust many playback and recording parameters.
When a professional videotape recording is made, color bars and a test audio tone are recorded at the beginning of the tape. These are audio and video reference signals that you can use to adjust the VCR during playback so the sound and picture are the same as those recorded. Figure 15.8 shows the configuration of color bars displayed on a video monitor. The top section of bars are, left to right, 80 percent grey, yellow, cyan, green, magenta, red, and blue.
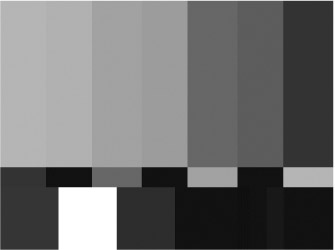
Figure 15.8: The color bars used to calibrate video playback.
Figure 15.9 shows properly-adjusted color bars as they would be displayed on a waveform monitor. The waveform monitor displays two seemingly identical side-by-side images. Each represents one field of a video frame. The video and color intensity of each bar is displayed on the graph, as well as other video components used for synchronizing the signal.
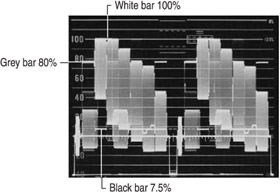
Figure 15.9: Calibrated color bars as displayed on the waveform monitor.
Color is adjusted by using a vectorscope. To explain how this instrument works, you need to know a bit about the NTSC standard. Color intensity is differentiated the same way as video intensity, by changes in voltage. The hue of the color (green, purple, yellow, and so forth), on the other hand, is differentiated by phase relationships in the color or chrominance signal. These phase relationships can be seen by displaying the chrominance of a video signal on a vectorscope, which displays phase relationships as degrees in a circle. For an overview of phase relationships, see the “Creating Color with Phase” sidebar. Figure 15.10 shows color bars displayed correctly on a vectorscope.
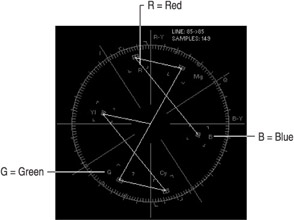
Figure 15.10: Calibrated color bars as displayed on the vectorscope.
If you are using the SDI connectors to capture a digital tape, the data is transferred directly to the computer, bypassing conversion and processor circuits. Without these circuits in the video signal chain, the video quality is better. However, direct transfer means you cannot adjust video parameters. If you connect to a composite output while playing back either a digital or analog tape, you access the video after the digital stream is converted to an analog signal and a processor has been applied. The quality is not as good, but you can adjust the video. In the following discussion, we will assume that the composite output is being used.
The Digital Betacam provides many controls, but the four you will use the most are Video, Set up, Chroma, and Chroma Phase:
-
Video. This control adjusts the overall intensity or brightness of the video. While playing the color bars, adjust the Video control so the grey bar on the left is at 80 percent on the waveform scale. The white bar should be no higher than 100 percent.
-
Set up. This control adjusts the black level. While playing the color bars, adjust the Set up control so the black bar on the right is at 7.5 percent on the scale. The 7.5 percent area is marked by a double line.
-
Chroma. This control adjusts the intensity of color. As you adjust Chroma, the shape on the vectorscope changes in overall size. With chroma all the way off, the shape is a point in the middle, which represents zero chrominance, or black and white.
-
Chroma phase. This control adjusts the hue of all colors. As you adjust the phase with the vectorscope, the shape rotates. For example, if you rotate the phase 40 degrees clockwise, the red bar would appear magenta and the cyan bar would appear green.
Six small boxes located just inside the outer circle represent the colors in the color bars: R is red, B is blue, G is green, and so forth. You adjust the color so the vertices of the six angles of the shape created by the color bars align with the six boxes in the scale.
Like color bars, the tone recorded on the audio tracks is the reference with which you can adjust the audio output level on the Betacam, and the input level on the encoding computer. Typically, the tone is recorded at 0 decibels (dB). Decibels is the standard measurement of relative signal level. If you adjust the level control so the meter registers at zero on the scale, the audio will play back at the same level it was recorded. Figure 15.11 shows a VU (volume units) meter displaying a tone set to 0 db.
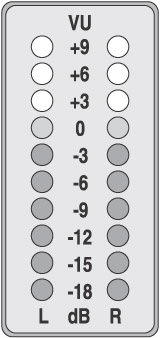
Figure 15.11: A VU meter is used to measure audio levels.
VU meters are used to ensure that audio levels are maximized and consistent without exceeding the upper limit of an audio circuit and recording medium. As you raise the level above 0 db, the signal will at some point become distorted. It will become increasingly distorted as you continue to raise the level. When you are adjusting audio from a source other than a test tone, you should typically keep the level as close to 0 as possible without going over too often. For most audio amplifiers and tape recorders, this method will provide the optimum sound level without objectionable distortion.
With analog devices, there are different levels of distortion. If the audio peaks over 0 db occasionally, you may not even notice any difference in the sound. With digital recording, on the other hand, no distortion is added to the sound until the clipping point is reached, and no sound can be recorded above that point. In other words, there is either no distortion or total distortion. Therefore, clipping must be avoided. On digital recorders, you see meters that have no indication above 0 db (or clipping). To allow some headroom, often sound engineers will set an upper limit at -18 db, and keep audio fluctuations at or below that point to avoid clipping. Figure 15.12 shows a digital audio meter with the test tone set at -18 dB.
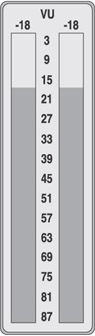
Figure 15.12: This audio signal measures -18 dB on a digital audio meter.
As with video, if you capture audio digitally, conversion and processing circuits are bypassed, so you cannot adjust audio levels.
The NTSC television standard was adopted in North America for television standards in the early 1940s, during the days of black-and-white television.
Until recently, television signals were analog signals, a system established in the 1930s that had color grafted onto it in the early 1950s. In this system, the signal was broadcast by breaking up and transmitting (or recording) images as a series of lines, one after the other. The signal itself is based on a varying voltage.
The television signal bandwidth is 6 MHz. When color was added, the original monochrome signal, called luminance (Y), was given the largest portion (0-4 MHz) of the channel, or bandwidth. This contains the brightness information and the detail.
In addition to the Y signal, color television includes two additional chrominance (C) signals, which contain color information for the orange-cyan signal (1.5 MHz) and the green-purple signal (0.5 MHz). These signals are added together to form the C signal.
A color television signal starts off looking just like a black-and-white signal. An extra chrominance signal is added by superimposing a 3.579545 MHz sine wave onto the standard black-and-white signal. Right after the horizontal sync pulse, eight cycles of a 3.579545 MHz sine wave are added as a color burst, as shown in figure 15.13.
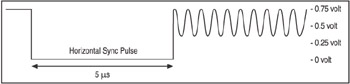
Figure 15.13: Elements of a color video signal.
Following these eight cycles, a phase shift in the chrominance signal indicates the color to display on the receiving television. The amplitude (or maximum absolute value) of the signal determines the color saturation. The following table displays the relationship between color and phase:
| Color | Phase |
| Burst | 0 degrees |
| Yellow | 15 degrees |
| Red | 75 degrees |
| Magenta | 135 degrees |
| Blue | 195 degrees |
| Cyan | 255 degrees |
| Green | 315 degrees |
A black-and-white television filters out and ignores the chrominance signal. A color television picks it out of the signal and decodes it, along with the normal intensity signal, to determine how to modulate the red, green, and blue components.
Patching the Signals
After configuring playback on the source, the technicians patch it to the encoding computer. They plug one end of a video patch cord into the Digital Betacam output, and the other end into an encoding computer input. Then they patch audio channels 1 and 2 of the Digital Betacam into the left and right channels of the encoding computer.
EAN: 2147483647
Pages: 258