Page Tracing
Page tracing is a feature of ASP.NET that makes it easy to get some in-depth information about the structure and execution of application pages. In this section, we’ll talk briefly about how to turn on tracing and gather information useful for analyzing performance. (See Chapter 10 for more information about using the tracing feature.) When you enable tracing for a page, you can track and view execution time for its various stages. Tracing tracks creation of the server controls along with how they are nested in the control tree, as well as the bytes used to render a particular control and the amount of view state information that control is providing so that it can be round-tripped to the client.
You can enable and view tracing information in two ways: first, via the web.config and machine.config files (which allow you control at the application and machine level); and second, via the Page directive. In the former approach, the trace element of the system.web configuration section controls the behavior of page tracing. By setting the enabled attribute to true, the information is gathered for all application requests. Code Listing 9-1 is a sample web.config file for enabling page tracing for an application.
Code Listing 9-1: Tracing Web.config
 <configuration>
    <system.web>
        <trace enabled="true"
               localOnly="true"
               pageOutput="false"
               requestLimit="10"
               traceMode="SortByTime"/>
    </system.web>
</configuration>
The enabled setting turns tracing off and on. The localOnly attribute controls whether the trace information is displayed in response to requests not made directly from the local machine. The pageOutput attribute controls whether the trace information should be shown at the end of each page requested, or retrieved via a separate request to the trace handler. The trace handler is accessed by making a request to the trace.axd handler for the application root being traced. For example, if page a.aspx is accessed with http://localhost/someApplicationRoot/a.aspx, the trace handler is accessed at http://localhost/someApplicationRoot/trace.axd. The requestLimit specifies how many page requests’ worth of information should be stored. Because a significant amount of data is accumulated in the trace information, consuming valuable server resources, we need to limit the amount of information stored. And finally, we can specify the default traceMode of SortByTime to retrieve the output in the sequence that the events occurred, or we can switch to SortByCategory to have the data grouped. Grouping is particularly useful when adding custom categories of tracing information.
You don’t have to enable tracing for an entire application to gather trace information for a page or set of pages. The Page directive also allows us to turn on tracing for a single page and is our second approach for viewing and enabling tracing information. By using this setting on a set of pages, we have a great approach for comparing the behavior of our pages on a fixed set of hardware.
Code Listing 9-2, TracingOutput.aspx, demonstrates adding custom information to the trace output by calling the Trace.Write method. The first parameter is the category name, and the second parameter is the message. Trace.Warn has the same effect, except that the output is red to draw attention to it.
Code Listing 9-2: TracingOutput.aspx
 <%@Page trace="true" %>
<%@Import namespace="System.Threading" %>
<script language="C#" runat="server">
protected void Page_Load(object o, EventArgs e) {
    Trace.Write("MyInfo", "started Page_Load");
    for(int i = 0; i < 20; i++) {
        Thread.Sleep(100);
        Response.Write(i + "<br/>");
        Trace.Write("MyInfo", "loop iteration number " + i);
    }
    Trace.Write("MyInfo", "ending Page_Load");
}
</script>
The output from a page being traced gives us a better understanding of where the page spends its time while executing and how it is composed of server elements. Figure 9-2 is an example of the page output from Code Listing 9-2. In the figure, you can quickly see by looking at the FromLast column that the Render phase took the most time for this request. We can also see that although the page shown in the figure has only a label, text box, and button (this is the Hello Scripted World.aspx code from Chapter 8), it does have several other literal server control elements present in the tree, resulting in several hundred bytes of view state.
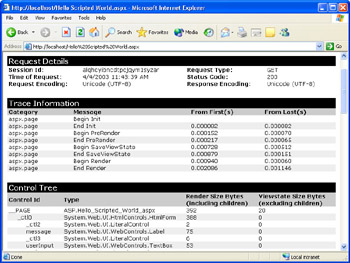
Figure 9-2: Traced output
Once a page is identified as needing performance work, look closely at the data in the trace output. Are controls being created that aren’t used? Perhaps a panel contains controls that are used only in certain circumstances. These could be moved to a separate page so that they aren’t created until needed. Perhaps output could be cached for portions of the page (see the “Using the Cache” section later in this chapter). Determine what stage of the page processing is taking the most time. Could some repeated work be done less frequently? Identify what about the page is contributing most to the slowdown and focus your efforts there. Take note of the view state size. When databinding controls, you can easily end up with a much larger view state than expected being passed between client and server. It might be more efficient to retrieve the data from the database and store it in Session or in the cache and redo the databinding than to round-trip all the data.
EAN: 2147483647
Pages: 144