Determine tonal quality by reading a histogram
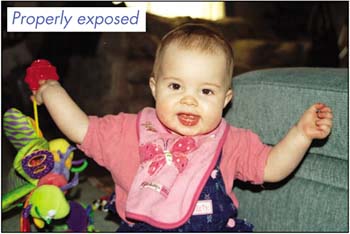
| We've all had it happensomeone gives you a less-than-stellar image to use for a project you're working on. When this occurs, you should immediately evaluate the image's tonal quality. After all, you probably don't want to spend countless hours trying to correct the image in Photoshop only to find out later that it isn't salvageable. One of the ways you can determine if an image is of quality, or if it can be saved, is to view its histogram. What's a histogram?In Figure A, we show an image with its histogram. This is an example of a quality image that has a well-dispersed tonal range, meaning that it has an acceptable amount of pixel data in all three rangesshadows, midtones, and highlights. A histogram is a graph, which represents the total tonal range of an image. The horizontal axis on a histogram shows the tonal range and the vertical axis shows the number of pixels, from 0 to 255, at each tonal value. The left side on the histogram shows shadow detail in an image; the right side shows its highlights; and all the detail in between are midtones. An image that's too dark, or underexposed, shows more detail on the left, and an image that's too light, or overexposed, shows more detail on the right. Figure A.
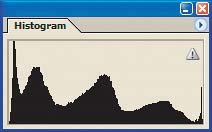
Note To view an image's histogram, choose Window A histogram can be pretty intimidating if you don't know what you're looking at. We'll define each item found in the Histogram palette, so you have a basic understanding. Then, we'll show you how to interpret the graph. To view the Histogram palette, open an image in Photoshop and then choose Window From the Histogram palette's pop-up menu, you can choose Expanded View to show the statistical information displayed in the graph. In this view, you can also choose to show the histogram of specific layers from the Source dropdown list (only available in a document with multiple layers). If you choose All Channels View from the Histogram palette's pop-up menu, a graph for each color channel is shown separately on the palette. Channel. This dropdown list allows you to view the histogram for every available channeleither combined or individually. Mean. Mean data represents the average intensity level of the image, layer, or selection. Std Dev. The data shown here indicates how widely the values vary within the entire image, layer, or selection. Median. This shows the middle intensity value of the image, layer, or selection. Tip You can view the histogram for an entire image (by default), a selection of the image, or a specific layer in the image. To select an area in an image, choose the Rectangular Marquee tool Pixels. This shows the total number of pixels in the image, layer, or selection. Level. Place your mouse pointer anywhere on the histogram to display the area's level of intensity in this field. Count. Place your mouse pointer anywhere on the histogram to show the number of pixels of the current intensity level in this field. Percentile. Place your mouse pointer anywhere on the histogram to show the total number of pixels at or below the pointer. Cache Level. This shows the level of image cache used to display the histogram. The histogram is dynamic. That is, as you make tonal corrections with the Levels command, you can see a before and after view of the histogram on the Histogram palette. The darker portion on the graph is the adjusted histogram, while the faded portion represents the original histogram, as shown in Figure C. Figure C.
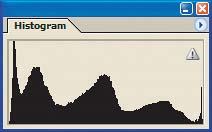
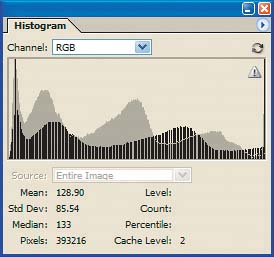
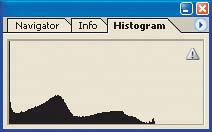
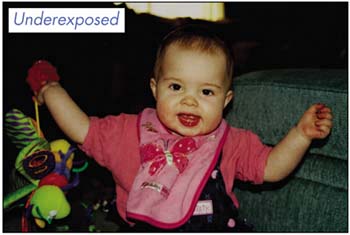
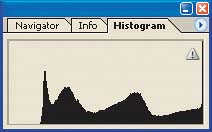
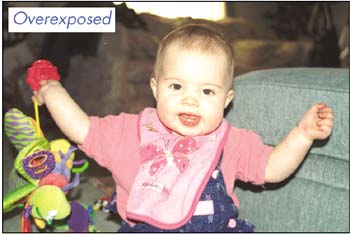
You also now have the ability to refresh the histogram display to view the image's true histogram. Simply click the Cached Data Warning button Reading a histogramPhotoshop is an image-editing application but, even though it has a magic wand, it isn't a magician! Sometimes, an image simply doesn't contain enough information for you to produce a quality photo. You can ascertain this before wasting time trying to correct an image by simply viewing the histogram. In Figure D, we show an underexposed image and its histogram. The tonal range in the image is concentrated on the left side of the graph, indicating too much detail in the shadows and not enough detail in the highlights. In Figure E, we show an overexposed image and its histogram. Here, you can see that there are barely any pixels in the shadows. Most of the intensity is on the right side of the graph, in the highlights. Therefore, both images lack too much information and probably wouldn't benefit from tonal correction. And we're able to determine this just by looking at the graph, so, if a Mean value of 92.13 still doesn't mean anything to you, don't worryit doesn't have to! Figure D.
Figure E.
Note For information on how to fix overexposed images, see the Problem : Solution "Restore overexposed photos" at the end of this chapter. Worth the effortWhen you work with images for many different projects and you receive them from different sources, it's important to know what sort of images you're working with. You can correct many images with positive results, but others may not be able to be fixed. By viewing an image's histogram first, you can determine if what you're working with is, well, worth the hard work! |

EAN: N/A
Pages: 105