21.4 Creating Stock Charts
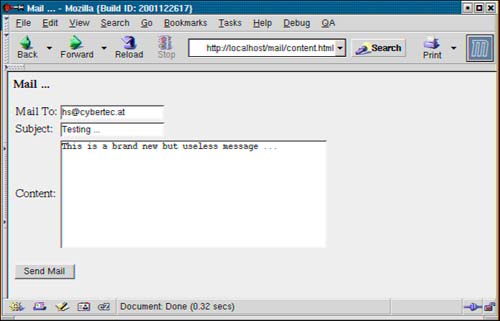
| Modern applications are not only used to store data; they also are essential for displaying data in a easy-to-understand and comfortable way. One application where displaying data plays a key role is tools for displaying information about stocks. The progression of the value of a certain stock is displayed in charts and can easily be displayed using PHP's GD interface. In this section you will see how to build a rudimentary tool for monitoring stocks. Keep in mind that you will see a rudimentary application, not a sophisticated one. The reason is that writing a complex application leads to tons of code that cannot be discussed in this book reasonably. Therefore we prefer to focus on the essential components of such an application. The first thing to do is to create a table for storing the information you will need to generate the dynamic image. This can be done using a simple CREATE TABLE statement: phpbook=# CREATE TABLE stock (name text, curdate date, curval numeric(9,2)); CREATE Now that a table has been created, you can use the COPY command to insert some data into it: phpbook=# COPY stock FROM stdin; Enter data to be copied followed by a newline. End with a backslash and a period on a line by itself. >> Cybertec 2002/1/1 12.32 >> Cybertec 2002/1/2 12.65 >> Cybertec 2002/1/3 12.59 >> Cybertec 2002/1/4 13.00 >> Cybertec 2002/1/5 12.80 >> Cybertec 2002/1/6 12.99 >> Cybertec 2002/1/7 15.12 >> Cybertec 2002/1/8 16.89 >> \. If no error occurred, the data has been added to the table successfully. In the next step you can write a user form where the user can select the stock he wants to retrieve information about as well as the interval the user wants to be displayed. The following listing shows a simple HTML form: <HTML> <HEAD> <META HTTP-EQUIV="CONTENT-TYPE" CONTENT="text/html; charset=iso-8859-15"> <TITLE>Monitoring Tool</TITLE> </HEAD> <BODY> <P><FONT FACE="Courier, monospace"><FONT SIZE=5 STYLE="font-size: 20pt"> <B>Monitoring Tool</B> </FONT></FONT></P> <P><FONT FACE="Courier, monospace"><FONT SIZE=4 STYLE="font-size: 16pt"> <FORM ACTION="stock.php" METHOD="POST"> <TABLE> <TR><TD>Stock: </TD><TD><INPUT TYPE="TEXT" NAME="name"></TD></TR> <TR><TD>Beginning: </TD><TD><INPUT TYPE="TEXT" NAME="start"></TD></TR> <TR><TD>End: </TD><TD><INPUT TYPE="TEXT" NAME="end"></TD></TR> <TR><TD></TD><TD><INPUT TYPE="SUBMIT" NAME="Generate Chart"></TD></TR> </TABLE> </FORM> </FONT></FONT></P> </BODY> </HTML> The form is simple. It consists of three input fields plus one button for submitting the data. If somebody clicks the button, stock.php is called. In Figure 21.11 you can see what the form looks like. Figure 21.11. Inserting data.
Of course, this is just a simple form and many features can be added to it easily. Let's get to stock.php, which contains the code for retrieving the data from the database: <?php # including library for generating picture include("image.php"); # connecting to the database $dbh = pg_connect("dbname=phpbook host=localhost user=hs"); if (!$dbh) die ("connection to the database cannot be established\n"); # generating image $xsize = 400; $ysize = 300; $image = genimage($xsize, $ysize); # finding maximum value in chart $findmax = "SELECT max(curval) FROM stock WHERE name='$name'"; $retvalue = pg_exec($dbh, $findmax); $retrow = pg_fetch_row($retvalue, 0); $max = $retrow[0]; # computing scale $scale = $ysize*0.9 / $max; # executing query for retrieving data $sql = "SELECT curdate, curval FROM stock WHERE curdate >= '$start' AND curdate <= '$end' AND name='$name' ORDER BY curdate"; $data = pg_exec($dbh, $sql); if (!$data) die ("cannot execute query<br>\n"); $rows = pg_numrows($data); if ($rows < 6) die("not enough data<br>\n"); # drawing grid $image = drawgrid($image, $xsize, $ysize, $rows); # retrieving data $black = ImageColorAllocate($image, 0, 0, 0); for ($i = 0; $i < $rows - 1; $i++) { $rescur = pg_fetch_array($data, $i); $resnext = pg_fetch_array($data, $i + 1); ImageLine($image, ($i + 0.5) * $xsize / $rows, $ysize - $rescur["curval"] * $scale, ($i + 1.5) * $xsize / $rows, $ysize - $resnext["curval"] * $scale, $black); } # displaying header and sending picture to browser header ("Content-type: image/png"); ImagePng($image); pg_close($dbh); ?> First a file called image.php is included. This file contains a set of functions for drawing images efficiently. You will take a closer look at this library after you have gone through stock.php. After including the library, a connection to the database is established. In case of an error, PHP will quit the script and an error is displayed. If no error has occurred, the function genimage is called. This function can be found in image.php and is used to generate an empty, white image. The return value of the function is the image handle you will need for the steps that are still to come. Now that a connection to the database has been established and an image has been created, the data is selected from the database. The maximum value in the table belonging to the stock you are interested in is selected. This is necessary in order to compute the scale of the image. As you can see, the y coordinate of the maximum value will be 90% of the total height of the image. No matter what the maximum value is, it will always be at the same coordinate. After computing the scale, the data needed to draw the graph is retrieved. As you can see, dates are taken from the user form and are used directly without modification. Keep in mind that the data returned by the database must be ordered by date. This is necessary because otherwise the data might not be returned in the appropriate order. In many real-world applications you will see that a graph is drawn on top of a grid. In this application the grid is drawn with the help of drawgrid. Just like genimage, this function has been implemented in image.php. After the query executes, it is time to retrieve the data. The records are retrieved by processing a for loop. This loop is executed $rows - 1 times. You will soon see why the loop is not processed $rows times. At the beginning of the loop, the current as well as the next record in the result are retrieved. These two records are necessary to draw a line from one point to another. Every point contains the value of the stock on a particular day. The most important part of this loop is to see how the line is drawn. In the case of $rows records in the result, it is possible to draw exactly $rows - 1 rows without using records outside the interval the user has defined. To take this into consideration, the position of the line is drawn from ($i + 0.5) * $xsize / $rows to ($i + 1.5) * $xsize / $rows. $i defines the day in the list, and $xsize defines the size of the image. By dividing the result of the multiplication by $rows, it is possible to compute the size of the slice marking one day. $i + 0.5 can be seen as the middle of the first day the user wants to take a look at. After all lines are displayed, the result is sent to the browser. Of course it is possible to add additional text or lines to the scenario. You can do this easily by using PHP's functions for working with text. We have decided not to add text to the chart to keep the application small and simple. After you have gone through stock.php, it is time to take a look at image.php: <?php # library for drawing images function genimage($xsize, $ysize) { $image = ImageCreate($xsize, $ysize); if (!$image) die("cannot create image<br>\n"); # painting background $white = ImageColorAllocate($image, 255, 255, 255); ImageFill($image, 1, 1, $white); return $image; } # drawing a grid and borders function drawgrid($image, $xsize, $ysize, $rows) { # drawing border $black = ImageColorAllocate($image, 0, 0, 0); $points = array(0,0, 0,$ysize-1, $xsize-1,$ysize-1, $xsize-1,0); ImagePolygon($image, $points, 4, $black); # drawing grid $xdiff = $xsize / ($rows - 1); # for vertical lines $ydiff = $ysize / 5; # for horizontal lines # drawing vertical lines for ($i = 1; $i < $rows; $i++) { ImageLine($image, $xdiff * $i, 0, $xdiff * $i, $ysize, $black); } # drawing horizontal lines for ($i = 1; $i < 5; $i++) { ImageLine($image, 0, $ydiff * $i, $xsize, $ydiff * $i, $black); } return $image; } ?> The first function is needed to create new images. It creates an image that has the size passed to the function. If the image cannot be created, an error will occur. There are several reasons that PHP cannot create the image. The next listing contains a compilation of the most common errors as well as a list of what you have to take care of when using a function such as genimage:
The next function in the library is called drawgrid and is used to add the grid to the scenario. Depending on the number of days, you want to display information about, the number of lines will differ. After the user inserts data into the form in select.html and clicks the button, a chart will be generated. The output is shown in Figure 21.12. Figure 21.12. A simple chart.
As you have seen in this section, generating charts is easy when working with PHP and PostgreSQL. With just a few lines of code you can draw good-looking diagrams and charts. If you want to draw other kinds of diagrams, you can do that as well. The advantage of the GD module is that it is a standard interface for generating graphics, which makes it flexible and reliable. |
EAN: N/A
Pages: 201