Value Stream Mapping and Process Flow Tools
Overview
Purpose of these tools
- Visually documents a process (including key data as captured on a value stream map)
- Provides fact-based process description as basis for understanding current problems (poor flow, rework loops, delays, etc.) and opportunities
- Enables teams to quickly see improvement opportunities within the process and begin defining critical Xs (underlying causes)
- Helps team see how a process should work (future state) once they eliminate waste
- Helps communicate inside and outside the organization
Deciding which tool to use
- Tips on process mapping, p. 34, gives practical tips for generating a useful process map. Review as needed.
- Process observation, p. 36, gives tips for going out to watch what really goes on in a process. Always a good idea at the beginning of a process improvement project, even if you think your team members already have a lot of process knowledge.
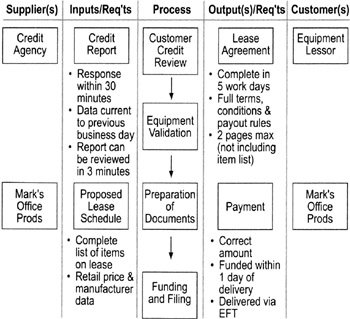
- SIPOC, p. 38, is a simple diagram for identifying the basic elements of a process (boundaries, supplier inputs, process inputs, steps, customers and outputs). Most teams will want to do a SIPOC diagram at the beginning of their project to capture a high-level view of targeted operations (helps communicate with sponsors and others). SIPOC is a good tool for translating customer requirements into output requirements and identifying related Key Process Output Variables (KPOVs).
- Process mapping steps, p. 39, covers the elements of creating a flowchart.
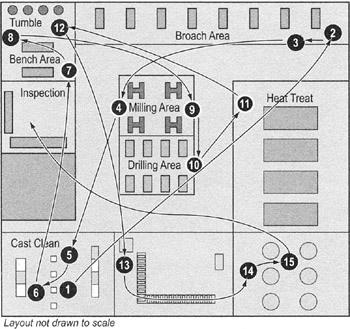
- Transportation diagrams, spaghetti/workflow diagrams, p. 42, are specialized maps that show unique ways to depict different aspects of workflow. Skim through to see if they could help your project.
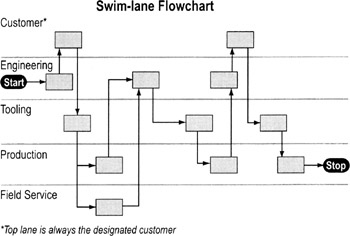
- Swim-lane (deployment) flowcharts, p. 43, are especially useful when the process being studied goes across three or more functions. Very often there are discontinuities in the process during the hand-offs between functions. Effective at showing the many handoffs, transports, queues and rework loops in a process.
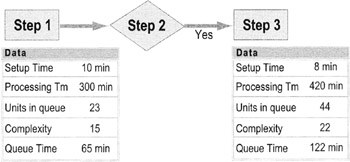
- Value stream map, p. 45, is a "process map with data"—a tool for capturing process data (on WIP, setup time, processing time/unit, error rates, idle time, etc.) as well as flow. The foundation for Lean improvement methods. Mandatory tool for all teams whose mission is to speed up the process and eliminate non-value-add cost. (See also the complexity value stream map on p. 243)
- Value-add/non-value-add analysis, p. 49, gives guidelines for identifying which work in a process your customers value and which they do not value. Every project that involves process improvement should establish before and after levels of value-add and non-value-add cost.
- Time Value Map, p. 52, and Value-add Chart (task time or takt time chart), p. 53, are visual tools for emphasizing how process time is divided between value-add and non-value-add work. Particularly recommended for teams whose members are new to thinking in VA/NVA terms.
Process mapping
Key principles
- Documentation is no substitute for observation. You MUST walk the process and talk to the staff to find out what really goes on day to day. Do this even if you're studying a work area you think you already know!
- A flowchart is a means, not an end. Don't get so wrapped up in creating the perfect flowchart that you delay the value-add work on a project. Only go to a level of detail that is helpful for the project.
- Boundaries of what to map should come from your project charter. If boundaries are not spelled out, check with your sponsor(s).
- Involve a cross-representation of those who work in the process to create the map. No one person will have all the process knowledge you need.
- Process maps are meant to be used. If your maps sit on a shelf or are stuck in one person's computer, they aren't doing you much good. Establish practices that make them living documents; refer to them in all team meetings, use in training and retraining; update with each process change, etc.
Recommended process maps
- Process study should include at a minimum…
- SIPOC diagram
- Basic value stream map with value-add vs. non-value-add identification; add other project-critical metrics as applicable
- Process observation
- If you work in transactional processes, you may find the swimlane/functional deployment format more informative because it emphasizes the handoffs between people or groups
- If your project will focus on improving the workplace, use a workflow diagram to get a visual map of the workspaces
Decide on level breadth of the flowchart…
High-level view: Depicts the major elements and their interactions. Should show the role of feedback and information flow. Useful early in a project to identify boundaries and scope. (Not useful during improvement because of lack of detail.)
Low-level view: Depicts specific actions, workflow, rework loops, etc., in a process. Useful for a process of limited scope; too cumbersome when all you need is a view of the overall flow.
Select current (as is) vs ideal (should be or future) vs updated (to be) versions
Current/as-is: Captures the process as it works today. Most projects should include a current map of the project.
- If the problems are so severe that a major process redesign is required, create an ideal/future map instead
Ideal/future/should-be: Created by asking "What would we do if we didn't have any of the restrictions we have today? What would we do if we could start from scratch?" Helps teams see the work in a new way and generate creative ideas about how to do the work better or faster.
- Stretch your team's imagination by quickly constructing a future state map that contains only the value-added steps. The comparison of current reality to this "Ideal" future will generate a lot of improvement ideas.
- Should-be maps must be consistent with the goals set down in a team's charter.
Updated/to-be: Describes the new process flow after changes are implemented. Do a to-be chart as part of solution planning or when designing or redesigning a process.
| Tip |
|
Process observation
Highlights
- Observing a process in action gives team members a deep understanding of reality and can spark ideas about improvement opportunities and solutions
- Observation works best if you plan what you want to do and how you will capture and use the insights people gain
To observe a process…
- Clarify the purpose of observation.
- Is this a general walkthrough or is there a specific purpose (Ex: observing handoffs at a specific step)
- Identify observers.
- If possible, include both experienced and novice process operators/staff
- Prepare an observation form and train observers.
- Create a form to capture process data or general impressions
- Train all observers in how to use the form; hold practice runs to make sure everyone is using the form in the same way
- Prepare staff in the workplace.
- Well in advance of the observation session, alert people in the affected work area about the timing and purpose of the observation
- Get permission from a process owner, supervisor, or manager; make sure it's OK to conduct the observation session and talk to process operators/staff
- Walk the process; carry out your observations plans.
- Have observers summarize lessons learned and present them to whole team. Discuss the results.
- Try to determine the "best repeatable time." Then have your team discuss how to make "best repeatable" the standard for every step in the process.
Example Process Observation Form
(focus here is on process flow and timing)
|
Process Observed:__ |
Date:_ |
Time:_ |
|||||
|---|---|---|---|---|---|---|---|
|
Step |
Description |
Worker |
Distance from last step (in ft.) |
Task time |
Wait time |
WIP |
Observations |
|
Totals: |
|||||||
| Tips |
|
SIPOC
Highlights
- A process snapshot that captures information critical to a project
- SIPOC diagrams help a team and its sponsor(s) agree on project boundaries and scope
- A SIPOC helps teams verify that process inputs match outputs of the upstream process and inputs/expectations of downstream process(es)
To create a SIPOC diagram…
| Note |
You can vary the sequence of these activities. Often it works best to identify the process steps you're concerned with because that defines boundaries, then move on to Outputs/Customers, and back to Suppliers/Inputs. But do them in any order that makes sense for your project. |
- Identify process boundaries and key activities
- Keep at a high level, with perhaps 6 activities at most
- Identify the key outputs (Ys) and customers of those outputs
- Brainstorm outputs and customers
- If you have a lot of different outputs and customers, focus on a critical few
- Identify inputs (Xs) and suppliers
- Brainstorm inputs and suppliers
- If you have a lot of different inputs and suppliers, focus on a critical few
- Identify critical-to-quality requirements for the inputs, process steps, and outputs
- Remember, you'll have to verify this later with data collection
| Tip |
|
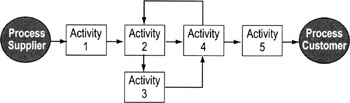
Process mapping steps
Highlights
- The basic steps for creating a process map are the same no matter what type of map you're creating.
- Strive for a level of detail that is useful to your project—no more, no less. Too much detail will bog you down; too little will make the flowchart useless.
To create a process map…
- Review the process being studied and its boundaries as defined for your project.
- Identify the type of chart you want to create.
- Have participants identify the steps in the process. Write each step on a self-stick note or card using the appropriate symbol (see p. 49).
- For "as-is" charts, include rework loops, delays, etc.
- For "should-be" charts, include only the work as you want it to flow.
- Working as a team, arrange the steps in order (by posting the self-stick notes on a blank flip chart, whiteboard, or table)
- Eliminate duplicates; combine similar ideas and agree on wording.
- Determine and maintain a consistent level of detail as you go.
- Keep the process flow moving in one direction, usually left-to-right or top-to-bottom. Only go in the reverse direction if a decision calls for repetition of a step. This helps people keep clear about the sequence of events, which can get confusing if you allow "time" to flow both backwards and forwards.
- If steps continue from one wall to another or over an obstacle (such as a picture on the wall), attach the connected steps with string and tape.
- Discuss the results. Does it match reality as you know it? Adjust as needed.
- If you discover you have forgotten a step, move the self-stick notes to the right and insert the new step (this is why it helps to work with self-stick notes that can be easily rearranged).
- When done, number the tasks sequentially through the most direct route, then number off-line tasks.
- Transfer completed map to paper or computer.
- Be sure to date the map and provide names of those involved in the mapping process.
| Tips |
|
Transportation and spaghetti (workflow) diagrams
Highlights
- Diagrams that depict the physical flow of work or material in a process
- Used to improve the physical layout of a workspace (office, factory, warehouse) or a work form
To create a workflow diagram…
- Find or create a diagram of the workspace (or obtain a hard copy of a form or worksheet if that is the target of improvement).
- Work from an existing flowchart of the process steps or brainstorm a list of steps.
- Mark where the first step of the process happens, draw an arrow from there to where the second step happens, etc. Continue until you have mapped all process steps.
- Discuss the final diagram with an aim towards improving the workflow.
- If the lines crisscross, experiment with workspace arrangements to create a cleaner flow (ideally, work will never back-track)
- If lines repeatedly come back to one location, see if the work performed there can be combined and performed at the same time (again, to prevent backtracking)
| Tips |
|
Swim lane (deployment) flowcharts
Highlights
- A flowchart that emphasizes the "who" in "who does what"
- Makes it easy to study handoffs between people and/or work groups in a process
- Especially useful with administrative (service) processes
To create a swim lane or deployment flowchart…
Review the basic flowcharting steps. The difference here is that you need to identify WHO does the work, not just what gets done.
- Identify the different people or job functions involved in the process. List them down the left side or across the top of a flip chart or whiteboard.
- Brainstorm the steps in the process and write them on self-stick notes.
- Work through each step in order, placing the notes in the appropriate swim-lane.
- Use conventional flowcharting symbols if appropriate.
- Use the result to spark discussions on how to improve workflow.
- The ideal is to have each person or work function touch the form or other item only once.
- Look for reasons behind repeated handoffs back and forth between individuals or work functions. Try to combine or resequence work so one person can complete all their tasks at one time.
- If missing or incomplete information is the source of back-and-forth handoffs, try to error-or mistake-proof the process (see p. 233) so work cannot move on to the next process task or step unless it's complete to that point.
| Tips |
|
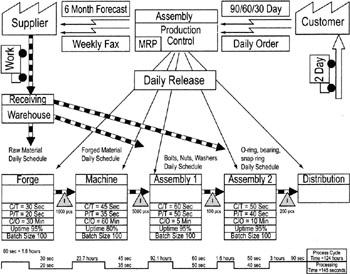
Value stream maps (basic)
Purpose
To capture all key flows (of work, information, materials) in a process and important process metrics
Why use a value stream map
- More complicated to construct than other flowcharts, but much more useful for identifying and quantifying waste (especially in time and costs)
When to use a value stream map
- Use at the business (strategic) level by management teams and deployment champions for opportunity and project identification.
- Maps at this level are owned by the business unit leaders (management teams, deployment champions)
- Create an "as-is" version at the project (tactical) level in Define and Measure to identify and visualize the improvement opportunities. Create a future version ("should-be") in Improve or Control.
- Maps at this level are created and initially owned by improvement teams and transitioned to process owners during the DMAIC Control Phase
- If your team has to assess the impact of multiple products or services, see Chapter 10 on Complexity (p. 241).
How to create a value stream map
Prework: Create SIPOC and top-down or swim-lane flowcharts as appropriate to identify scope, key metrics, and basic process steps.
- Determine what individual product, service, or family you will map. If there are multiple options use a Product/Service Family Grid (p. 242) to identify the family. Choose one that meets as many of these criteria as possible:
- Has a common flow (all products/services in the family use essentially the same steps)
- Has high volume and cost
- Meets industry or other segmentation criteria important to the company
- Has the biggest impact on customers or the customer segment of choice
- Draw the process flow
- Review process mapping symbols (see p. 49)
- Begin at the end of the process with what's delivered to the customer and work upstream
- Identify the main activities
- Place the activities in sequence on the map
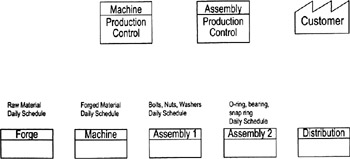
- Add the material flow
- Show the movement of all material
- Group together material with the same flow
- Map all subprocesses
- Include any incoming inspection, and material and process testing activities
- Add supplier(s) at beginning of process
- See symbols, p. 49
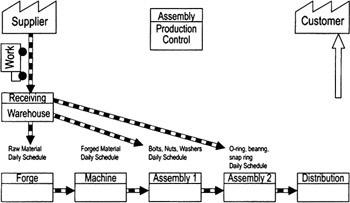
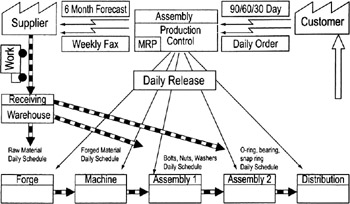
- Add the information flow
- Map the information flow between activities
- For manufacturing areas:
- Document the production orders associated with the parts through the process
- Document the scheduling system and tracking of the parts as they move through the process
- Document how the process communicates with the customer and supplier
- Document how information is gathered (electronic, manual, "go look," etc.)
- Collect process data and connect it to the boxes on the chart
- Walk the process to observe reality
- For each step, gather the following data:
- Trigger-what starts the step
- Setup time and Processing time/unit
- Takt rate (rate of customer demand)
- Percent defective and/or scrap rate (in mfg.)
- Number of people
- Downtime % (includes any time that people cannot reach full productivity because machines, computers, materials, information, etc., is not available when needed)
- WIP downstream and upstream
- Cost of links to IT, warehouse(s), etc.
- Batch size
- Add process and lead time data to the chart
- Include delays (queue times), processing (value-add) time, setup time, etc.
- Verify the Map
Have non-team members who know the process review the flow and data. Check with suppliers and customers as well (interface points). Make changes as needed then check the final results with people who work on the process.
| Tips |
|
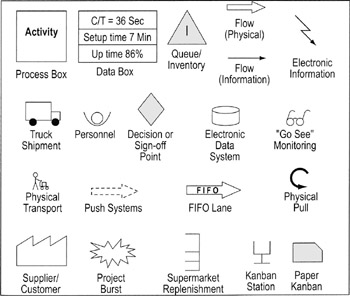
Flowchart and value stream symbols
Value add (VA) vs non value add (NVA) analysis
Highlights
- Used to distinguish process steps that customers are willing to pay for from those they are not
- The objective of VA/NVA analysis is to:
- Identify and eliminate the hidden costs that do not add value for the customer
- Reduce unnecessary process complexity, and thus errors
- Reduce the process lead time; improve PCE
- Increase capacity by better utilizing resources
To perform a value analysis…
- Classify each process step as value-added (also known as "customer value-add"), business non-value-add (sometimes called "required waste"), and non-value-add. See descriptions below.
- Add up the time spent in each category. Use a Time Value Map (p. 52) or Value-add Chart (p. 53) to display the results.
- Decide what to do next.
- Value-add tasks should be optimized and standardized
- Business non-value-add tasks should be checked with the customer and, where possible, minimized or eliminated
- Non-value-add activities should be eliminated
Value classifications
- Value-Added (VA), also called Customer Value-Add (CVA): Any activity in a process that is essential to deliver the service or product to the customer
- Must be performed to meet customer needs
- Adds form or feature to the service
- Enhances service quality, enables on-time or more competitive delivery, or has a positive impact on price competition
- Customers would be willing to pay for this work if they knew you were doing it
- Tip: If it's not clear whether a task is value-added to your customers, imagine what would happen if you STOP doing it. Would your external or end customer complain? If yes, then it's likely value-add.
- Business Non-Value-Added (BNVA): Activities that are required by the business to execute VA work but add no real value from a customer standpoint
- Usually includes work that:
- Reduces financial risk
- Supports financial reporting requirements
- Aids in execution of value-add work
- Is required by law or regulation
Ex: Order entry/processing; purchasing, product development; sales/marketing; IRS/OSHA/EPA reporting
- Tip: Pick an activity. If you STOP doing it now, would your internal customers complain? If yes, then it is probably business non-value-add.
- Usually includes work that:
- Non-Value-Added (NVA) or waste: Activities that add no value from the customer's perspective and are not required for financial, legal, or other business reasons
- The types of NVA work are endless. They include:
- handling beyond what is minimally required to move work from value-add to value-add activity (includes inspection, transportation, moving/storing materials/paper-work, counting, storing, retrieving)
- rework needed to fix errors
- duplicative work (supervision or monitoring of work, multiple signatures, proofing, checking of calculations, inspection)
- waiting, idle time, delays
- Overproduction (producing too much too soon)
- Unnecessary motion by process staff
- Overprocessing (too many steps to complete a job or exceeding customer requirements)
- Tip: Pick an activity. If you STOP doing it now would any customer (internal or external) know the difference? If not, the work is probably non-value-add.
- The types of NVA work are endless. They include:
| Tip |
|
Time value maps
Highlights
- A visual depiction of value-add and non-value-add time in a process
- Gives better impression of overall cycle time than Value-add chart (see next page)
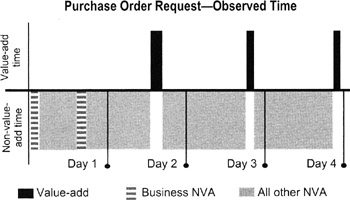
To create a time value map…
- Determine process cycle time
- Determine queue times (delays) between steps and the value-add time needed to perform each task
- Draw a timeline and divide into units equal to the total process time
- Place steps and delays along the timeline in the order in which they happen; use segments proportional to the times
- VA steps go above the line
- Non-value-add goes below the line (think about using different colors for emphasis)
- The white space between boxes indicates queue or delay time
- Draw in feedback loops and label yield percentages
- Summarize time use
- Activity vs. non-activity times
- Value-add vs. non-value-add times
Value add chart (task time or takt time chart)
Highlights
- A visual depiction of value-add and non-value-add time in a process
- Does more to illustrate balance of time between process steps; weaker on overall cycle time (compare to time value map on previous page)
- Does not visually emphasize wasted time as strongly as a time value map does but makes it easier to compare steps to each other
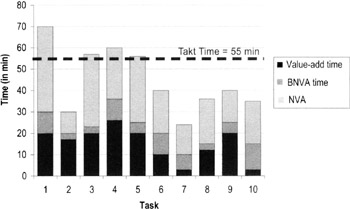
To create a value add chart…
- Follow instructions in the value-add analysis (p. 49) to classify process work as customer value-add (VA), business non-value-add (BNVA), or other non-value-add
- For each step in the process, collect data on how much time is spent on each type of work
- Visually display the results in a bar chart like that shown here
- Calculate takt time
- The takt time is the amount of available work time divided by the customer demand during that time period.
Ex:
- 8 available hours = 480 min
- 60 customer orders to be filled
- takt time = 480/60 = 8 min
- (you should complete an order every 8 minutes to satisfy customer demand)
- The takt time is the amount of available work time divided by the customer demand during that time period.
- Act on the result by brainstorming ways to:
- Eliminate NVA activities
- Improve VA activities
- Reduce BNVA activities
| Tips |
|
The Lean Six Sigma Pocket Toolbook A Quick Reference Guide to Nearly 100 Tools for Improving Process Quality, Speed, and Complexity
- Using DMAIC to Improve Speed, Quality, and Cost
- Working with Ideas
- Value Stream Mapping and Process Flow Tools
- Voice of the Customer (VOC)
- Data Collection
- Descriptive Statistics and Data Displays
- Variation Analysis
- Identifying and Verifying Causes
- Reducing Lead Time and Non-Value-Add Cost
- Complexity Value Stream Mapping and Complexity Analysis
- Selecting and Testing Solutions
EAN: N/A
Pages: 185
