Starting the Debug Console
After installing the plug-in, ensure that the module has started (from either the deployer or the Web console). If it has not been started, you can start the debug console from the command line by starting the geronimo/debugconsole/1.1/car module, or use the Web console. From the command line, in the bin directory, you can enter the following:
deploy –user system –password manager start geronimo/debugconsole/1.1/car
From the Web console, click on the Web App WARs link under the Applications heading, and then click the start link next to the geronimo/debugconsole/1.1/car configuration. Figure 7-6 shows the debug console configuration started in the Geronimo Web console.
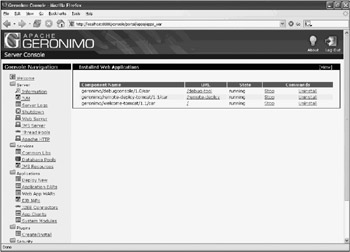
Figure 7-6: Debug console configuration started in Geronimo console
You can also stop the debug console, if you need to, through the Geronimo Web console.
Starting the jconsole JMX Console
jconsole is the GUI-based JMX console tool that is included with JDK 1.5 and beyond. jconsole provides you with visibility into the exposed MBeans in a system. It can connect to a local JVM or to a remote JVM over a network.
If you are running JDK 1.5 and want to monitor Geronimo and troubleshoot with jconsole, you need to do the following:
-
Configure Geronimo JVM to accept remote management.
-
Start Geronimo.
-
Start jconsole.
-
Connect jconsole to the running instance of Geronimo.
Each of these steps is detailed in the following subsections.
Configuring Geronimo JVM to Accept Remote Management
This is actually performed at the JVM level. A property, com.sun.management.jmxremote, must be defined. This is best done by modifying the bin/setjavaenv.bat script file (or equivalent bin/setjavaenv.sh for Linux/*nix). This script is executed before Geronimo is started.
If you set a GERONIMO_OPTS environment variable in this file, the value of this variable will be used as JVM arguments to the JVM that Geronimo runs in.
In this case, add the lines highlighted in the following listing to your copy of bin/setjavaenv.bat. Of course, you should make this modification only after you have shut down the Geronimo server (if it is already running).
... @REM Begin all @REM lines with '@' in case GERONIMO_BATCH_ECHO is 'on' @if "%GERONIMO_BATCH_ECHO%" == "on" echo on @if not "%GERONIMO_BATCH_ECHO%" == "on" echo off set GERONIMO_OPTS=-Dcom.sun.management.jmxremote @REM check that either JAVA_HOME or JRE_HOME is set. set jdkOrJreHomeSet=0 ...
Start Geronimo
Run the startup.bat (or startup.sh) script located in the bin directory to start the Geronimo server.
Start jconsole
You should first ensure that you have the bin directory of your JDK 1.5 in your PATH environment variable. Starting jconsole is then as simple as typing the following command:
jconsole
If you want to attach jconsole to a specific instance of Geronimo running on the same host, you must first find the instance’s process ID. Use the Task Manager on Win32 or the ps command in Linux/*nix.
Then, the command is:
jconsole <process id of Geronimo>
Connect Geronimo to jconsole
If you have specified the process ID when you start jconsole, it will be connected to the Geronimo instance upon startup. Otherwise, jconsole will detect any available local running and exposed JVM instance. You see a selection screen similar to Figure 7-7.
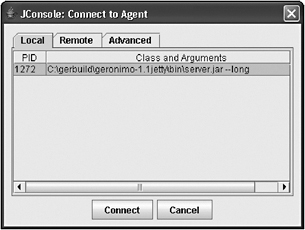
Figure 7-7: jconsole local running JVM section dialog
If you are using Win32, you must be using NTFS for your file system to see this list.
Select the instance and click Connect.
If you need to connect to a remote instance running on another machine, use the Remote tab of the dialog and provide the remote host/IP and port used.
Once you have connected successfully, you should see the first screen of monitored statistics on the Geronimo JVM, as shown in Figure 7-8.
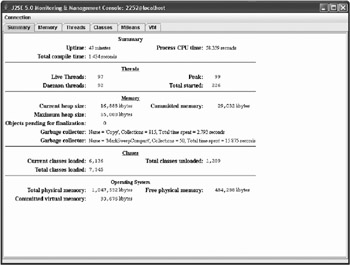
Figure 7-8: A successful connection to the Geronimo JVM
Accessing the Debug Console
Once it is started, you can access the debug console using a browser via the following URL:
http://localhost:8080/debug-tool/
Figure 7-9 shows the initial display of the debug console.
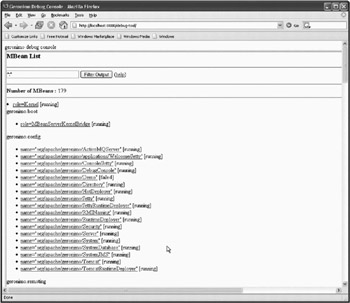
Figure 7-9: Initial display of the debug console
One thing that you will notice immediately in Figure 7-9 is the raw appearance of the display. Unlike the Web console, which is designed for frequent user and administrator use, the debug console is really designed only for developers and expert administrators. Because of this heritage, the debug console is not dressed up with GUI elements.
Looking through the initial page, you should recognize some Geronimo JSR-77 domain names, and also some links that look like JSR-77 object names.
In Figure 7-9, the objects in the geronimo.config and geronimo.boot domain are not standard J2EE typed objects. They are specific to Geronimo. As such, they do not need the j2eeType key or any mandatory parent j2eeType keys. But if you scroll down and take a look at the objects under the geronimo.server domain, you will see all the j2eeType components there.
Filtering the Components That Are Displayed
There is a Filter Output button at the top. This area lets you specify a filter to select the MBeans that are displayed. The general syntax of this filter is:
<domain name>:<key value to match>
An asterisk (*) can be used to denote wildcard match. Initially, the filter is *:*, which will match all the available MBeans across all available domains. In the case in Figure 7-9, there are a total of 179 MBeans managed by the kernel.
If you want to see all the MBeans from deployed application components, for example, you may enter the following:
geronimo.server:*
This will show all the components in the geronimo.server domain - which according to Table 7-3 is the domain where deployed application components live.
Figure 7-10 shows the result of this filtering.
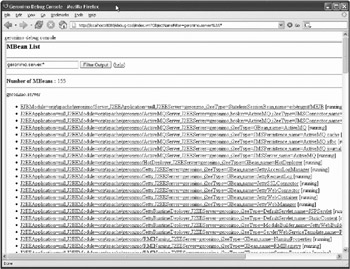
Figure 7-10: Querying for deployed application components by using a domain filter
In Figure 7-10, you have used the filter on geronimo.server domain to query the debug console for all deployed application components.
Note in Figure 7-10, the very first object is a StatelessSessionBean (j2eeType) with name ejb/mgmt/MEJB. This is the very MEJB component that the debug console is using to query for MBean information! If you look through the other objects in this domain, you will find components in every deployed application. All of these objects have JSR-77 object names. You can confirm this against Table 7-2. Now you can see how an understanding of JSR-77 object name helps in the use of the debug console.
Note that the current JSR-77 managed state is shown beside each and every component inside the square bracket [...]. This state information is used frequently in troubleshooting when a module may have stopped or failed silently. The Web console can also be used to display some of these states, but it may not be as reliable and often does not display all the possible state variations
If you are using jconsole, just click on the MBeans tab, then select geronimo in the displayed tree. Select the geronimo.geronimo subtree. Figure 7-11 shows the components exposed via jconsole.
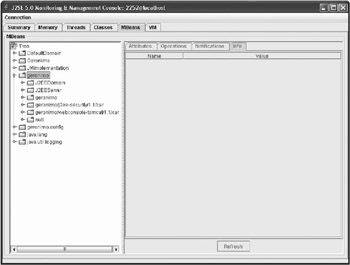
Figure 7-11: jconsole display of Geronimo MBeans
EAN: 2147483647
Pages: 148