Using SQL Profiler
3 4
In addition to using Query Analyzer to find inefficient T-SQL statements, you can use the SQL Profiler utility. Profiler can view all T-SQL statements that are running on the system and graphically display information about them. It also provides sorting and filtering options you can use to locate the T-SQL statements that are using the most CPU and I/O resources. With this information, you can determine which T-SQL statements to concentrate on when you tune the statements. T-SQL statements that are invoked through an application can be viewed in Profiler; you don't have to access the application source code.
The Profiler utility in SQL Server 2000 is similar to the Profiler utility included in SQL Server 7, but it contains a few enhancements. One useful enhancement is the introduction of the trace template, which can be used to create trace files. (A trace must still be created before you can use it to trace SQL Server activities.) With SQL Server 7, traces had to be created by hand.
To invoke the Profiler utility and run a trace, follow these steps:
- Click Start, point to Programs, point to Microsoft SQL Server, and then choose Profiler. When the Profiler window first appears, it will be empty. No panes are opened within Profiler, and nothing is being profiled in SQL Server.
- To start profiling, you must choose an existing trace template or create a new trace template to run. (The startup process is described in step 4.) SQL Profiler provides a number of trace templates to choose from. Using these trace templates can save you time because you don't have to set up the trace from scratch. To examine the list of trace templates, click the File menu, point to Open, and choose Trace Templates to display the Open dialog box, shown in Figure 35-16.
Figure 35-16. The Open dialog box showing available trace templates.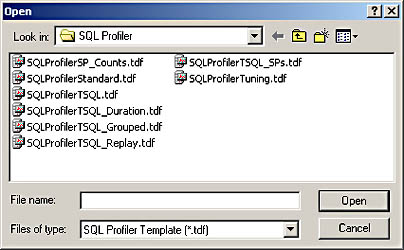
The trace templates that come with SQL Server are described here:
SQLServerProfilerSP_Counts.tdf Counts the number of stored procedures that have been run. The results are grouped by the stored-procedure name and include the number of times the procedure was executed.
SQLServerProfilerStandard.tdf Collects general information about connections, stored procedures executed, and SQL batches in the order that they were executed.
SQLServerProfilerTSQL.tdf Collects all the T-SQL statements in the order in which they were submitted to SQL Server by the user community. The trace contains simply the T-SQL statements and the times they were issued.
SQLServerProfilerTSQL_Duration.tdf Displays the T-SQL statements that have been issued as well as the time (in milliseconds) those T-SQL statements required to execute.
SQLServerProfilerTSQL_Grouped.tdf Collects data similar to that collected by the SQLServerProfilerTSQL trace, but groups the statements by the users that submitted them.
SQLServerProfilerTSQL_Replay.tdf Provides detailed information about the T-SQL statements that have been issued. This trace provides data that can be used to replay T-SQL statements in Query Analyzer.
SQLServerProfilerTSQL_SPs.tdf Displays the specified stored procedure as well as the T-SQL commands within that stored procedure. The results are displayed in the order that they were executed.
SQLServerProfilerProfilerTuning.tdf Collects data about stored-procedure and SQL batch execution.
These trace templates can be quite useful. For example, the trace template SQLServerProfilerTSQL_Duration can help you determine which T-SQL statements are taking the most time to execute. This information gives you a place to start when you want to optimize a query. The statement might be running slowly because it has a lot of work to do, or it might be running slowly because it is inefficient. As you will see in the next step, you must use a predefined template for every trace.
- To start a trace, click File, point to New, and then choose Trace. The Connect To SQL Server dialog box appears, as shown in Figure 35-17. In this dialog box, select a SQL Server system to trace, and then click OK.
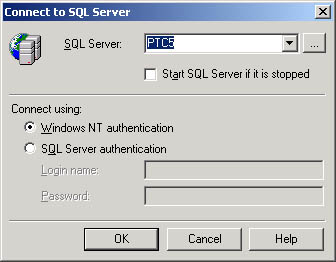
Figure 35-17. The Connect To SQL Server dialog box.
- The Trace Properties window appears, as shown in Figure 35-18. On the General tab, you can name the trace and choose a trace template to start from. For this example, select the SQLServerProfilerTSQLDuration trace template. On the lower part of the tab, you can specify whether you want to capture the trace to a file or to a SQL Server table. If neither of these options is chosen, the trace will be sent only to your screen. In addition, you can specify a time for the trace to finish. This can be quite useful for long-running traces.
Figure 35-18. The General tab of the Trace Properties window.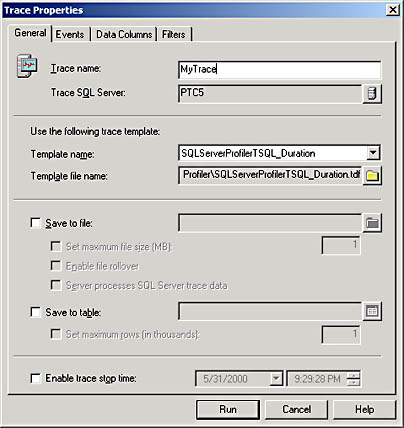
- Next click the Events tab, shown in Figure 35-19. This tab allows you to select one or more events that the trace will capture. A number of categories of events and specific events can be traced. Event classes listed in the Available Event Classes list box include Cursors, Errors And Warnings, Locks, Objects, Scans, SQL Operators, Stored Procedures, Transactions, and TSQL.
Figure 35-19. The Events tab of the Trace Properties window.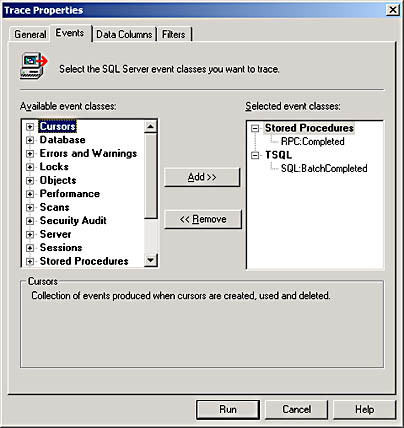
- After you select events you want to trace, click the Data Columns tab, shown in Figure 35-20. On this tab, specify what data will be collected during the trace. This data can include end time, object ID, and so on.
Figure 35-20. The Data Columns tab of the Trace Properties window.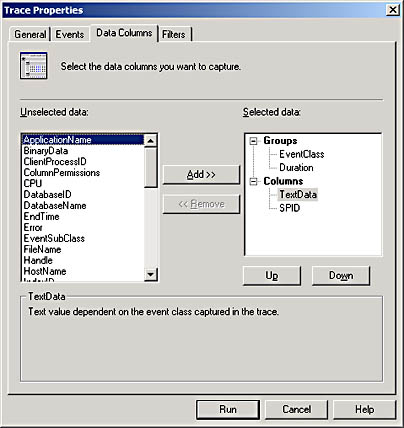
- Click the Filters tab, shown in Figure 35-21. On this tab, you can specify whether you want Profiler to include or exclude specific events. For example, you should exclude tracing Profiler itself. (This is the default setting.) By excluding SQL Server processes, you will make the Profiler window less cluttered and easier to read.
Figure 35-21. The Filters tab of the Trace Properties window.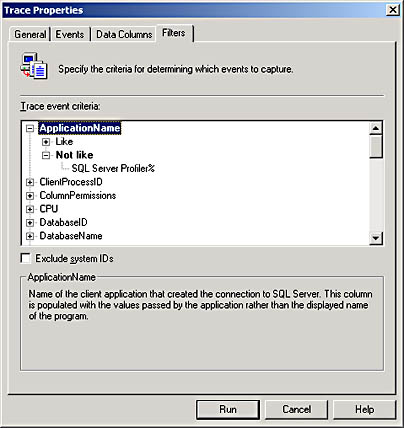
- When you are finished setting options, click Run to start the trace. If you have made any modifications to the trace template, it is recommended that you save this modified trace template under a different name using the Save As option under the File menu. Once the trace is started, events appear in the Profiler window as they happen. With the trace template we chose in this example, the events are sorted by duration (in milliseconds). Figure 35-22 shows the Profiler window displaying the results of a trace.
CAUTION
Profiler can use significant system resources in a busy environment. The more events you trace, the more overhead will be used.
Figure 35-22. A running trace.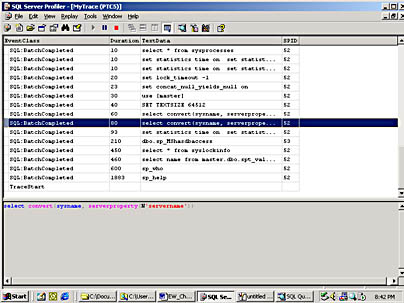
EAN: N/A
Pages: 264