Hack 48. Never Trust an Honest Coin
| Of all that is sacred in the often secular world of statistics, no concept has more faith than the honest spin of an honest coin. Fifty percent chance of either heads or tails, right? The troubling answer is, apparently...no! A basic explanation of chance and how it operates almost always includes a simple example of flipping or spinning a coin. "Heads you win; tails I win" is the customary method for settling a variety of disputes, and the binomial distribution [Hack #66] is usually described and taught as the pattern of random coin outcomes. But as it turns out, if you spin a coin, especially a brand-new coin, it might land tails up more often than heads up. Shiny New PenniesYou know the look and feel of a brand-new, mint-condition penny? It's so bright that it looks fake. It's so detailed and sharp around the edges that you have to be careful not to cut yourself. Well, get yourself one of them bright, sharp little fellas and spin it 100 times or so. Collect data on the heads-or-tails results, and prepare to be amazed because tails is likely to come up more than 50 times. If our understanding of the fairness of coins is correct, a coin should come up tails more than half the time less than half the time. (Say that last sentence out loud and it makes more sense.) Not with the spin of a new penny, though. New coins, at least new pennies, tend to have a crisp edge that actually is a bit longer or taller on the tail's side (the tail side is imprinted a little deeper into the penny than the head side). Figure 4-4 gives a sense of how this edge looks. If you spin an object shaped like this, there is a tendency for the side with the extra long edge to land face-up. Figure 4-4. Spinning a new penny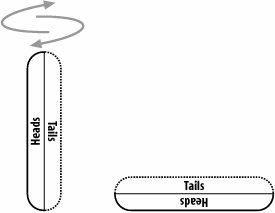 Imagine spinning the cap from a bottle of beer or soda pop. Not only would it not spin so well, but you also wouldn't be surprised to see it land with the edge side up. A new penny is shaped kind of like a bottle cap, just not quite so asymmetrical. The little extra edge, though, is enough over many spins to give tails the advantage. Binomial ExpectationsThe possible existence of a bottle-cap effect presents a testable hypothesis: The probability of a freshly minted spinning penny landing with tails up is greater than 50 percent. Of course, just by chance, over a few flips we might find a coin landing tails up more often than heads, but that wouldn't really prove anything. We know that chance will bring results in small samples that don't represent the nature of the population from which the samples were drawn. Our sample of coin spins should represent a population of infinite coin spins. If we spin a coin 100 times and find 51 tails, is that acceptable evidence for our hypothesis? Probably not; chance could be the explanation for a proportion other than .50. How about 52 tails? How about 52 percent tails and a million spins? Statistics comes to the rescue once again and provides a standard by which to judge the outcome of our experiment. We know from the binomial distribution that 100 spins of a theoretically fair coin (one without the unbalanced edge weirdness) will produce 51 or more tails 42 percent of the time. Old-school statistical procedures require that an outcome must have a 5 percent or lower chance of occurring to be treated as statistically significantnot likely to have occurred by chance. So, we probably wouldn't accept 51 percent after 100 spins as acceptable support for the hypothesis. On the other hand, if we spun that hard-working coin 6,774 times and got 51 percent tails, that would happen by chance only 5 percent of the time. Our level of significance for that result is .05. Table 4-19 shows the likelihood of getting a certain proportion of tails just by chance, when the expected outcome is 50 percent tails. Deviations from this expected proportion that are statistically significant can be treated as evidence of support for our hypothesis.
Notice that the power of this analysis really increases as the sample size gets big [Hack #8]. You need only a slight fluctuation from the expected to support your hypothesis if you spin that coin 500 or 1,000 times. With 100 spins, you need to see a proportion of tails at or above .58 to believe that there really is an advantage for tails with a newly minted penny. The distance of the observed proportion from the expected proportion is expressed as a z score [Hack #26]. Here's the equation that produces z scores and generated the data in Table 4-19: The probability assigned is the area under the normal curve, which remains above that z score. Where It Doesn't WorkOnce you prove to yourself that this tail advantage is real, heed this reminder before you go running off to win all sorts of crazy wagers. You must spin the coin! Don't flip it. Say it with me: spin, don't flip. See Also
|
EAN: 2147483647
Pages: 114