Debugging
So, what do you do if things don't go quite right? Obviously, you need to debug. Fortunately, Visual Studio .NET has a very powerful, language-neutral debugger. No matter what Microsoft .NET language you code in, the debugger will work. And if you happen to be working in a multilanguage environment, transitions between languages while debugging are completely transparent. You will only be working with Managed C++ here, but if you code part of the program in C# and part in Managed C++, any change in language while stepping through the code will be nearly unnoticeable, except that the code language in the debugger will change.
The Visual Studio .NET debugger has all the standard features of a modern debugger, including
-
Unconditional breakpoints
-
Conditional breakpoints
-
Single-line stepping
-
Stepping into methods
-
Stepping over methods
-
Stepping out of methods
-
Auto variable display
-
Local variable display
-
Variable watching
-
Immediate commands
-
Call stack
-
Threads
-
Registers
-
Modules
-
Memory
You will probably use most of these features at one time or another while debugging code. Of course, a well-placed debug statement also comes in handy sometimes. This book is about Managed C++, and not debugging, so you'll just take a quick look at some of the debugger's features.
Setting Breakpoints
Two types of breakpoints, unconditional and conditional, are available to you while you're debugging. Unconditional breakpoints stop the program whenever the break line is about to be executed. Conditional breakpoints, on the other hand, examine some type of condition first and, if the condition meets certain criteria, stop execution at the line where the break is specified.
Unconditional breakpoints are simple to set. All you need to do is click the border to the left of the line you want to break on. A longer but equivalent method is to select the line to break on, right-click, and then select Insert Breakpoint from the drop-down menu.
Conditional breakpoints are a little more complex to set. To create a new conditional breakpoint, you need to right-click the line where you want the break to occur and then select New Breakpoint. This will bring up the dialog box shown in Figure 6-32. If the line currently has an unconditional breakpoint, you can change it to a conditional by right-clicking the breakpoint and selecting Breakpoint Properties from the drop-down menu.
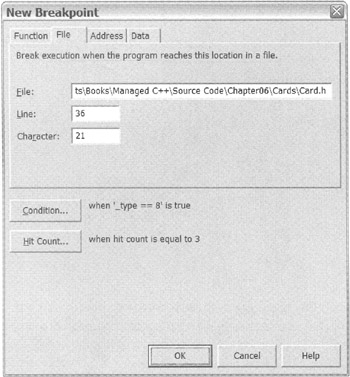
Figure 6-32: New Breakpoint dialog box
From within the dialog box, you can set a condition to break on by clicking the Condition button. You can use almost any condition that would be valid in an if statement at the location of a break. In Figure 6-32, the condition being set is_type == 8. You can also set the program to break based on the number of times the breakpoint has been executed by clicking the Hit Count button. In Figure 6-32, the program will break the third time the breakpoint is executed. As you can see, you can get pretty accurate in specifying when to break execution. In Figure 6-32, you are breaking when the third card with a value of 8 is dealt.
After you set a breakpoint—either conditional or unconditional—the debugger responds by placing a red dot in the left border next to the line on which you want the break to occur (see Figure 6-33).
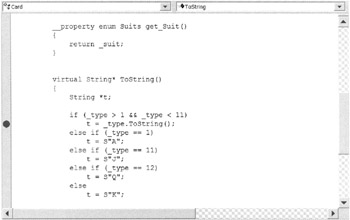
Figure 6-33: The breakpoint's red dot (in black and white)
Navigating
Now that you have a breakpoint, it is possible to run the application and have it stop at the location specified. The quick way to run a program in debug mode is to press F5. A more long-winded way of starting the debugger is to select Debug ➣ Start from the main menu.
Once the debugger starts, you will see Visual Studio .NET change into a desktop more suited to debugging. The views change to enable monitoring of the variable and the stack location. The toolbar changes to enable code navigation. And, as you can see in Figure 6-34, an arrow is placed over the red dot. This arrow specifies the next line that will be executed if you were to continue the program.
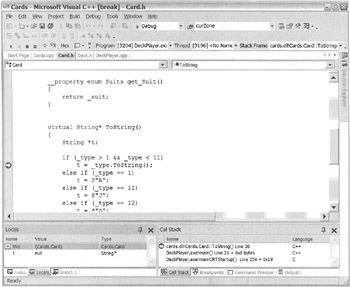
Figure 6-34: The debugger transformation
Visual Studio .NET has a lot of flexibility when it comes to navigating around the source code. The following options are available to you:
-
Step through the program line by line (F10 and F11). When you arrive at a method, you have the option to step into (F10) or over (F11) this method.
-
Execute to the location of the cursor (right-click at cursor location and select Run To Cursor from the drop-down menu).
-
Run until you exit the current method (Shift-F11).
-
Run until the next breakpoint or the end of the program (F5).
Two other, less frequently used navigational tools are Solution Explorer and the Call Stack window. Solution Explorer allows you to select a different source code module to navigate to. Once in the new module, you have the option of setting a breakpoint or executing to your current cursor location. The Call Stack window (see Figure 6-35) allows you to quickly navigate to the call stack. This can come in handy if you want to figure out which methods were called to get to your breakpoint. You can also use it to quickly navigate out of a deeply nested breakpoint by navigating to the cursor at a method higher up the stack. This is equivalent to pressing Shift-F11 a few times.
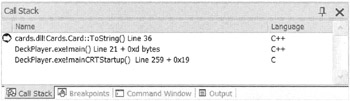
Figure 6-35: The Call Stack window
Examining Variables
It's all fine and dandy that you can navigate around the code, but if you can't see what values the variables contain, then the debugger is pretty useless. Visual Studio .NET provides several ways of examining the contents of the variable in the program you're debugging.
A unique feature of Visual Studio .NET's debug environment is that passing the cursor over a variable and leaving it there for a second will cause the value of the variable to be displayed (see Figure 6-36). The value can be retrieved through the more conventional methods that I describe next, but this feature comes in handy.
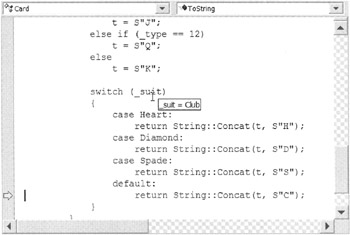
Figure 6-36: Pop-up variable values in the debug window
The Autos window is convenient if you only care about the variables being used by the current line being executed or the previous one. Frequently when you debug a program, you set a breakpoint on a line where you want to monitor the value of a variable. This being the case, the Autos window provides a shortcut in retrieving this information, as the only variables that are contained in this view are those on the line being executed and the line immediately before (see Figure 6-37).
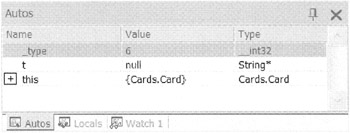
Figure 6-37: The Autos window during debugging
The Locals window displays all the variables with local scope to the current line of code being executed (see Figure 6-38). For programs with few variables, the Locals window can resemble the Autos window. For more complex programs with many variables with local scope, this view can become quite packed with variables, making it potentially difficult to find the exact variable you want.
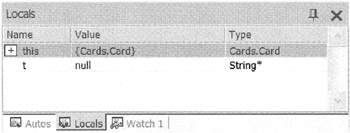
Figure 6-38: The Locals window during debugging
Sometimes there is one variable that you want to pay careful attention to. This is a job for the Watch window (see Figure 6-39). Usually, I use this view to monitor a variable that has an unexpected value when the program ends. By using a watch on the variable, I can see exactly when the unexpected value is set in the variable. Because you are selecting a specific variable to watch, it requires an extra step on your part to place the variable in the view. All you have to do is simply select the variable in the main debug window and then drag it to the Watch window.
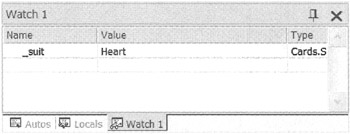
Figure 6-39: The Watch window during debugging
EAN: 2147483647
Pages: 169