14.5 The results
|
| < Free Open Study > |
|
14.5 The results
Table 14.6 shows the results of completed experiments by each of the teams for the four databases studied.
| Query # | Informix | DB2 | SQL | Oracle |
|---|---|---|---|---|
| 1 | 510 | 510 | 431 | 335 |
| 2 | 21,600 | 3,180 | 44 | 81,840 |
| 3 | 3,180 | 842 | 465 | 532 |
| 4 | 1,530 | Error: unknown | 300 | 1,818 |
| 5 | Error: memory | Error: unknown | 314 | 20,040 |
| 6 | 250 | 388 | 245 | 269 |
| 7 | Error: unknown | Error: unknown | 311 | 466 |
| 8 | Error: syntax | 27,157 | 309 | Error: syntax |
| 9 | Error: syntax | 1,286 | 409 | Error: syntax |
| 10 | 2,760 | 30,672 | 316 | 529 |
| 11 | 95 | 144 | 41 | 199 |
| 12 | 480 | 453 | 298 | 464 |
| 13 | Not run | 126 | 89 | Error: syntax |
| 14 | 660 | 460 | 253 | 331 |
| 15 | 600 | 338 | 247 | 600 |
| 16 | 240 | 915 | 54 | 2,848 |
| 17 | Not run | 797 | 504 | 2,700 |
| 18 | 12,660 | 1,127 | 1,169 | 8,100 |
| 19 | 240 | 354 | 250 | 1,091 |
| 20 | Not run | 467 | 288 | Not run |
| 21 | Error: unknown | 1,569 | 809 | 1,560 |
| 22 | Error: unknown | 594 | 61 | Error: syntax |
| CPU Use | 100% | 100% | 100% | 100% |
| Mem. Use | 30% | 100% | 100% | 38% |
Note that the time for each query is measured in seconds. As can be seen from the table, a side-by-side comparison of the databases is not entirely possible. This is due to many factors, as will be discussed shortly. The major reason appears to be the memory use by each database. Only Microsoft and DB2 were able to acquire and use 100 percent of their available memory, while Oracle and Informix were able to use only one-third of the available memory. To compare all the database systems together some assumptions have been made. First, it is clearly visible by a cursory review that Microsoft SQL beats DB2 in performance from the results depicted in Table 14.6. Upon a more comprehensive review of the data presented in Table 14.6, we find that DB2 runs between 1.03 times faster than SQL Server down to 0.01 times the performance of SQL Server. Also note that DB2 only performs better than SQL Server for one test, test 18, which looks at large-volume customers. In all other cases SQL Server outperforms DB2 on average by 53 percent. Given these results, we can now focus on comparing Microsoft SQL against Informix and Oracle.
The assumption is to decrease the amount of memory that Microsoft SQL uses to the same level as Informix and Oracle. In doing this we use a linear approach to find the new times. The theory is that if you cut the amount of memory by 50 percent, it will take twice as long. In these tests, since Informix and Oracle used one-third the memory of SQL Server, we assume that the time would be proportional to 3.33 times that of a system with one-third the memory. It should be noted that this has not been tested. Also, since not all queries could be run on Informix or Oracle, only those queries that ran on these systems have been taken into account. All other queries have been dropped. Keeping this in mind we have two new tables, Table 14.7 and Table 14.8, for Informix and Oracle.
| Query # | Informix | SQL |
|---|---|---|
| 1 | 510 | 1,437 |
| 2 | - | 147 |
| 3 | 3,180 | 1,550 |
| 4 | 1,530 | 1,000 |
| 5 | - | 1,047 |
| 6 | 250 | 817 |
| 7 | - | 1,037 |
| 8 | - | 1,030 |
| 9 | - | 1,363 |
| 10 | 2,760 | 1,053 |
| 11 | 95 | 137 |
| 12 | 480 | 993 |
| 13 | - | 297 |
| 14 | 660 | 843 |
| 15 | 600 | 823 |
| 16 | 240 | 180 |
| 17 | - | 1,680 |
| 18 | 12,660 | 3,897 |
| 19 | 240 | 833 |
| 20 | - | 960 |
| 21 | - | 2,697 |
| 22 | - | 203 |
| Mem. Use | 30% | 30% |
| Query # | Oracle | SQL |
|---|---|---|
| 1 | 335 | 1,437 |
| 2 | 81,840 | 147 |
| 3 | 532 | 1,550 |
| 4 | 1,818 | 1,000 |
| 5 | 20,040 | 1,047 |
| 6 | 269 | 817 |
| 7 | 466 | 1,037 |
| 8 | - | 1,030 |
| 9 | - | 1,363 |
| 10 | 529 | 1,053 |
| 11 | 199 | 137 |
| 12 | 464 | 993 |
| 13 | - | 297 |
| 14 | 331 | 843 |
| 15 | 600 | 823 |
| 16 | 2,848 | 180 |
| 17 | 2,700 | 1,680 |
| 18 | 8,100 | 3,897 |
| 19 | 1,091 | 833 |
| 20 | - | 960 |
| 21 | 1,560 | 2,697 |
| 22 | - | 203 |
| Mem. Use | 38% | 38% |
Comparing Informix against Microsoft SQL Server using the recomputed performance values, we see that 7 of the 12 queries ran faster on Informix than on Microsoft SQL Server. As can be seen in Figure 14.7, Informix is 67 percent faster. If we look more closely at these data, we can see that the Informix database performs between 3.4 times faster down to 0.3 times the speed of the scaled SQL Server. The overall weighted difference places Informix's performance at 1.48 times that of the SQL Server's scaled performance.
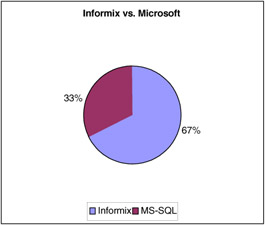
Figure 14.7: Informix versus Microsoft SQL Server.
Comparing Oracle against Microsoft SQL Server using the recomputed performance values, we see that 9 of the 17 queries run faster on Oracle than on Microsoft SQL Server. As can be seen in Figure 14.8, Oracle is computed to be 57 percent faster on average. If we look more closely at these data, we can see that the Oracle database system performs between 4.2 times faster down to 0.001 times the speed of the scaled SQL Server. The overall weighted difference places Oracle's performance at 1.76 times that of the SQL Server's scaled performance.
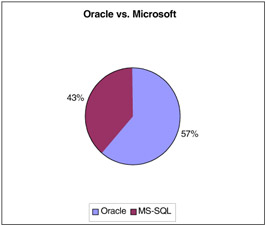
Figure 14.8: Oracle versus Microsoft SQL Server.
Thus, under our assumptions utilized to perform this weighted analysis, both Informix and Oracle perform better than SQL Server under most conditions. We still need to determine whether Informix's database is superior to Oracle's database given the same comparisons. To do this analysis we have normalized both databases' data to run at 100 percent memory use. Table 14.9 shows the new weighted results.
| Query # | Informix | Oracle |
|---|---|---|
| 1 | 1,700 | 882 |
| 2 | - | - |
| 3 | 10,600 | 1,400 |
| 4 | 5,100 | 4,784 |
| 5 | - | - |
| 6 | 833 | 708 |
| 7 | - | - |
| 8 | - | - |
| 9 | - | - |
| 10 | 9,200 | 1,392 |
| 11 | 317 | 524 |
| 12 | 1,600 | 1,221 |
| 13 | - | - |
| 14 | 2,200 | 871 |
| 15 | 2,000 | 1,579 |
| 16 | 800 | 7,495 |
| 17 | - | - |
| 18 | 42,200 | 21,316 |
| 19 | 800 | 2,871 |
| 20 | - | - |
| 21 | - | - |
| 22 | - | - |
| Mem. Use | 100% | 100% |
Comparing Informix against Oracle using the recomputed performance values, we see that 9 of the 12 queries ran faster on Oracle than on Informix. As can be seen in Figure 14.9, Oracle is 75 percent faster on average than Informix. If we look more closely at these data, we can see that the Oracle database performs between 7.7 times faster down to 1.07 times the speed of the scaled Informix Server for all but two queries. For query 16 (parts/supplier) and for query 18 (large-volume customer) the Informix database ran significantly faster than Oracle: from 3.5 to 9.36 times faster to be exact. However, since these seem to be outlier queries, we computed the overall performance measures by removing the effect of these two and Oracle's two best performing queries. The overall weighted difference places Oracle's performance at 1.38 times that of Informix's Dynamic Server scaled performance. Thus, Oracle is the winner in terms of performance using these assumptions and tests.
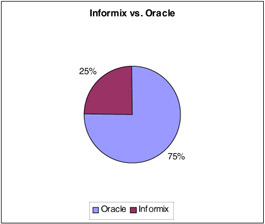
Figure 14.9: Informix versus Oracle.
14.5.1 Cost versus performance
Of course, performance is not everything. Cost must be taken into account. To consider cost we obtained a rough value for the purchase cost per database system and then computed a cost per second for performance.
To provide a rough comparison on cost we have averaged the amount of time it takes each database to run all of the queries used in the models and then used that value to divide the purchase cost (Table 14.10).
| Query # | Informix | DB2 | SQL | Oracle |
|---|---|---|---|---|
| 1 | 510 | 1,700 | 1,437 | 424 |
| 2 | 21,600 | 10,600 | 147 | 103,664 |
| 3 | 3,180 | 2,807 | 1,550 | 674 |
| 4 | 1,530 | 0 | 1,000 | 2,303 |
| 5 | 0 | 0 | 1,407 | 25,384 |
| 6 | 250 | 1,293 | 817 | 341 |
| 7 | 0 | 0 | 1,037 | 590 |
| 8 | 0 | 90,523 | 1,030 | 0 |
| 9 | 0 | 4,287 | 1,363 | 0 |
| 10 | 2,760 | 102,240 | 1,053 | 670 |
| 11 | 95 | 480 | 137 | 252 |
| 12 | 480 | 1,510 | 993 | 588 |
| 13 | 0 | 420 | 297 | 0 |
| 14 | 660 | 1,553 | 843 | 419 |
| 15 | 600 | 1,127 | 823 | 760 |
| 16 | 240 | 3,050 | 180 | 3,607 |
| 17 | 0 | 2,657 | 1,680 | 3,420 |
| 18 | 12,660 | 3,757 | 3,897 | 10,260 |
| 19 | 240 | 1,180 | 833 | 1,382 |
| 20 | 0 | 1,557 | 960 | 0 |
| 21 | 0 | 5,230 | 2,697 | 1,976 |
| 22 | 0 | 1,980 | 203 | 0 |
| Total Time: | 44,805 | 237,930 | 24,023 | 156,715 |
| Avg. Time: | 3,447 | 12,523 | 1,092 | 9,219 |
| Cost of DB: | 128,000 | 105,000 | 86,000 | 105,000 |
| $/Sec: | $37.14 | $8.38 | $78.76 | $11.30 |
Note that when taking the average time for each database, those queries that had 0 value were not taken into account. Table 14.10 shows that the cheapest DB in terms of cost and performance is DB2, followed by Oracle, Informix, and then Microsoft.
|
| < Free Open Study > |
|
EAN: 2147483647
Pages: 136