Using the Map Expert
| As you explore the charting capabilities of Crystal Reports, you will discover numerous powerful data visualizations that enhance the productivity of your reports and business users. Another valuable form of data presentation available in Crystal Reports is geographic mapping. This enables you to create reports that are logically grouped by geographically related information and that can communicate meaningful information in a familiar mapping model. When working with geographic data, you can quickly create a map or a map/chart combination on this data using the Map Expert. Tip The maps and mapping functionality provided within Crystal Reports are bundled from a third-party companyMapInfo. Additional map layers and types can be purchased directly from MapInfo and can be made accessible from Crystal Reports by adding them to the mapping folders under \Program Files\Map Info X. You can order additional mapping information from MapInfo at www.mapinfo.com. To open the Map Expert, either click on the Map Globe icon located on the Insert toolbar or access the Insert Map option under the Insert menu. Figure 8.9 displays the Map Expert dialog. Figure 8.9. The Map Expert dialog enables the rapid addition of mapping visuals to a report.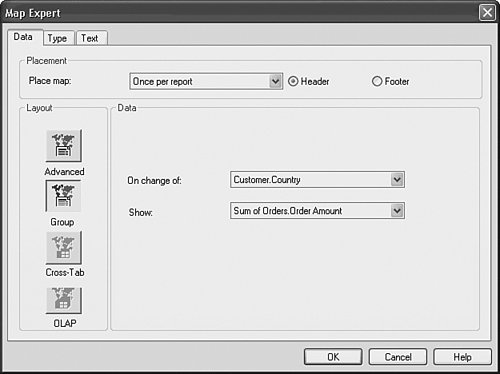 The next three sections introduce you to the functionality of the Map Expert and also escort you through a brief tutorial on the addition of a map to a sample Order Listing report slightly different than the one you just created. Using the Map Expert Data TabThe Data tab on the Map Expert dialog enables you to select the specific data that the map is based on and where it will be placed on the report. Figure 8.9 displays this tab of the Map Expert. The Data tab is composed of three different sections: Placement, Layout, and Data. These sections, and corresponding options, are discussed next. Specifying Map PlacementThe Map Placement section enables the selection of the location of the map on the report and consequently the recurrence of the map throughout the report. Using the Place Map drop-down box, select the section of the report where the map will be located (for example, Group 1, Group 2, and so on). The options available in this drop-down box are limited to the groups previously created in the report in addition to the option to create the graphic only once for the entire report. Using the radio buttons located beside the drop-down box, choose the header or footer of the selected report section. By making these selections, you have also determined the map's recurrence in the report because the map repeatedly appears in every section you have specified (for example, for each country in the group based on country). To begin with a walk-through of an example, perform the following steps:
Specifying Map LayoutThe Layout section specifies the data that the map uses. The actual data is selected in the Map Data section (described next), but the options presented in that section are dependent on the Map Layout button you have selected. Table 8.4 lists the different layout buttons and their typical use.
The next section explores the detailed data options enabled by the Advanced and Group Layout buttons. Caution If you attempt to create a geographic map based on a non-geographic field, the Map Expert accepts your request and then displays a blank map when it cannot resolve the selected field values to geographic entities. Make sure you select a valid geographic field in the Geographic Field item of the Advanced layout section or the On Change Of field in the Group layout section. Specifying Map DataAs you saw earlier, Figure 8.9 displays the Map Data section with the Group layout button selected. As described in Table 8.4, this layout option is designed to facilitate the quick creation of a map with a minimal amount of user interaction. To accomplish this rapid map creation, two pieces of information are requested through two drop-down boxes. The first drop-down box requests you to select the On Change Of field and the second the Show field. The On Change Of field is used to determine where the selected map breaks the report data to be displayed (for example, Country, State, or Province). The Show field specifies the summary field to be displayed for each break of the data. Note When using the Rapid Map Creation function of the Group layout option, you are limited to map creation based on existing summary fields already created in your reports and inserted into existing group sections. For more flexible map creation, use the Advanced layout option described later. Figure 8.10 displays the Map Data tab with the Advanced layout button selected. The additional options presented here provide you with improved flexibility in the maps that you can create. Figure 8.10. The Data tab with the Advanced layout button selected allows flexible selection of mapping data, layout, and placement.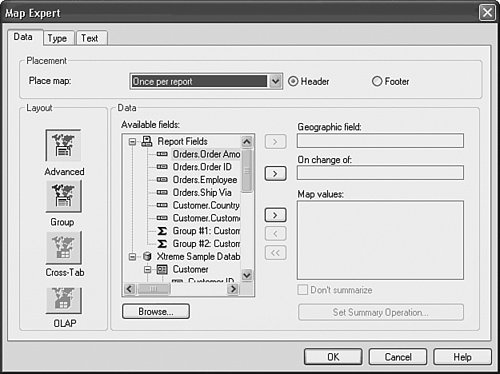 The familiar On Change Of field should be recognizable in this new window although it is selected in a more flexible manner using the selection buttons in the interface. It is selected in exactly the same manner as the Geographic field selection in this interface by selecting any of the fields in the Available Fields listing and clicking on the selection button. Note The Geographic and On Change Of fields are often the same, but can be set to be different. These are set to different field values when you want to present pie or bar charts on top of the involved map and for each of the different values in the selected Geographic field. An example of this would be presenting a pie chart for each country that highlights the different order amounts by companyindicated in the On Change Of field. After selecting your Geographic and On Change Of fields, a Map Values field must be selected to enable the map's creation. This selection specifies the summary field to be displayed for each break of the data and can come from any field (database, report, formula, and so on) that is listed in the available field's list. To select the Show Value fields, highlight the intended field and use the selection arrow buttons adjacent to the Map Values list box. Note As mentioned previously, you do not need to have had an existing summary on a report to summarize on it using the Advanced Mapping layout options. You can add any field to the Map Values list and then dynamically create a summary by clicking on the Set Summary Operation button. These dynamically created summaries are automatically created and used by the map. To continue adding a map to your sample report, follow these steps:
Using the Map Expert Type TabThe Type tab enables you to select from the five different types of maps that are available for presentation. The five map types can be logically broken into two distinct and separate categoriesmaps that present a summarization based on one variable, and maps that present a summarization based on two variables. The Type tab with these five map types is depicted in Figure 8.11. All five of the map types are also described in Table 8.5. Figure 8.11. The Map Expert Type tab enables you to select from the different types of maps available for display in your report.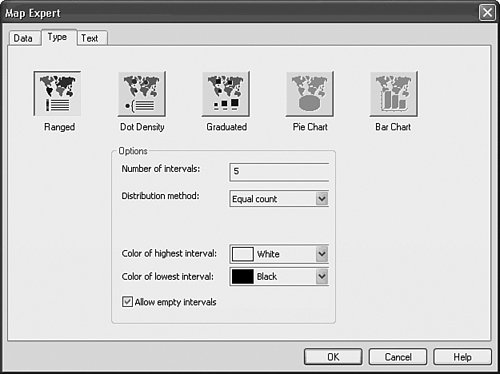
The first three map types shown base their maps on the summary of the selected Show Value field and for each Geographic fieldthe single fluctuating variable. The last two map types base their maps not only on the changing Geographic field, but also on a second fluctuating variable selected in the On Change Of field. Based on this second variable changing, either bar or pie charts are displayed on top of each of the involved Geographic fields. Table 8.5 describes the different map types, and includes a sample scenario for each. Each Map Type has a small number of associated options that can be set to customize the appearance of that particular map. You are encouraged to explore these options to help you find the maps most useful for your specific design goals. Using the Map Expert Text TabAfter a map's type and data have been selected, select the Text tab. This tab on the Map Expert dialog enables you to specify titles and legend formatting that the map uses when it is placed on the report. To finish adding a map to your sample report, follow these steps:
Figure 8.12. A sample Customer Orders Report with a geographic map.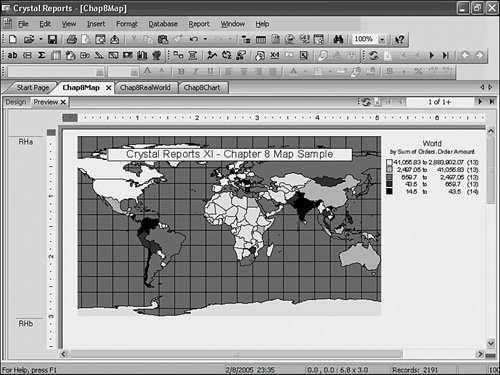 |
 For information on the Cross-Tab and OLAP layout buttons and their related options,
 EAN: 2147483647
Pages: 365