|  Crosstab queries are summary queries that let you determine exactly how the summary data appears onscreen. Crosstab queries rotate the axis of the datasheet and display the equivalent of repeating fields (often called buckets) in columns. Thus the datasheet displayed by a crosstab query doesn't conform to first normal form. Crosstab queries are closely related to Excel PivotTables and PivotTables you create with the PivotTable control of the Office Web Components (OWC). PivotTable and PivotChart views of queries are the subject of the next chapter. Crosstab queries are summary queries that let you determine exactly how the summary data appears onscreen. Crosstab queries rotate the axis of the datasheet and display the equivalent of repeating fields (often called buckets) in columns. Thus the datasheet displayed by a crosstab query doesn't conform to first normal form. Crosstab queries are closely related to Excel PivotTables and PivotTables you create with the PivotTable control of the Office Web Components (OWC). PivotTable and PivotChart views of queries are the subject of the next chapter.
 For more information on PivotTables, see "Slicing and Dicing Data with PivotTables," p. 463. For more information on PivotTables, see "Slicing and Dicing Data with PivotTables," p. 463.
With crosstab queries, you can perform the following operations: Specify the field that creates labels (headings) for rows by using the Group By instruction Determine the fields that create column headers and the criteria that determine the values appearing under the headers Assign calculated data values to the cells of the resulting row-column grid
T-SQL As mentioned earlier in the chapter, SQL Server doesn't support crosstab queries directly, so you ordinarily use PivotTables to display an equivalent to a Jet crosstab query. You can, however, write T-SQL stored procedures to emulate Jet crosstab queries. The "In the Real World Crosstab Queries" section at the end of this chapter describes a Visual Basic 6.0 application that generates T-SQL stored procedures from Jet crosstab queries. |
The following list details the advantages of using crosstab queries: You can display a substantial amount of summary data in a compact datasheet that's familiar to anyone who uses a spreadsheet application or columnar accounting form. The summary data is presented in a datasheet that's ideally suited for creating graphs and charts automatically with the Access Chart Wizard. Designing queries to create multiple levels of detail is quick and easy. Queries with identical columns but fewer rows can represent increasingly summarized data. Highly summarized queries are ideal to begin a drill-down procedure by instructing the user, for example, to click a Details button to display sales by product.
Using crosstab queries imposes only one restriction: You can't sort your result table on calculated values in columns. You can't, therefore, create a crosstab query that ranks products by sales volume. Columns are likely to have values that cause conflicts in the sorting order of the row. You can choose an ascending sort, a descending sort, or no sort on the row label values in the GROUP BY field, which usually is the first column. Using the Wizard to Generate a Quarterly Product Sales Crosstab Query Access's Crosstab Query Wizard can generate a crosstab query from a single table, but an individual table seldom contains data suitable as the data source for a crosstab query. If you need more than one table to get the result you want from the Wizard, which is almost always the case, you must design a query specifically for crosstab presentation. Follow these steps to create a query and then use the Crosstab Query Wizard to generate a result set that shows quarterly sales by product for the year 1997:  Create a new query in Design view and add the Orders table and Order Details Extended query. Drag the OrderDate field of the Orders table and the ProductID, ProductName, and ExtendedPrice fields of the Order Details Extended query to the grid. Add Like "*/*/1997" as the criterion of the OrderDate field to restrict the data to a single year (see Figure 11.59). Create a new query in Design view and add the Orders table and Order Details Extended query. Drag the OrderDate field of the Orders table and the ProductID, ProductName, and ExtendedPrice fields of the Order Details Extended query to the grid. Add Like "*/*/1997" as the criterion of the OrderDate field to restrict the data to a single year (see Figure 11.59).
Figure 11.59. The source query for the first crosstab query is based on the sample Orders table and Order Details Extended query. 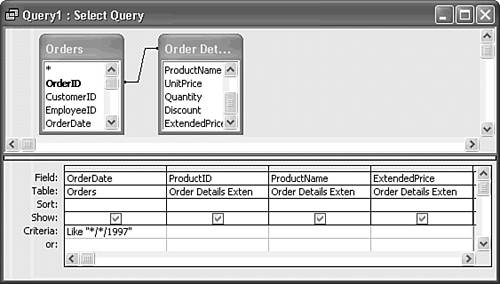  With the ProductID field selected, click the Properties button, click the Lookup tab, and select Text Box in the Display Control to revert from the ProductName lookup to the numeric ProductID value. Click Run to verify your design (see Figure 11.60). With the ProductID field selected, click the Properties button, click the Lookup tab, and select Text Box in the Display Control to revert from the ProductName lookup to the numeric ProductID value. Click Run to verify your design (see Figure 11.60).
Figure 11.60. This datasheet displays the first few rows of the result set from the design of Figure 11.59, which has a row for each Order Details item for orders received in 1997. 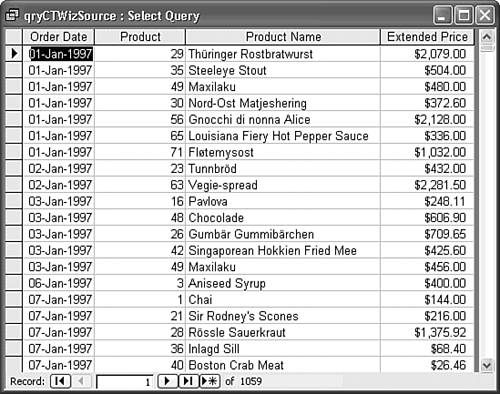 Close and save the query as qryCTWizSource. Click the Database window's New button to open the New Query dialog and double-click the Crosstab Query Wizard to open the Wizard's first dialog. Select the Queries option and then select qryCTWizSource from the list (see Figure 11.61). Click Next. Figure 11.61. Select the data source, usually a query, in the first Crosstab Query Wizard dialog. 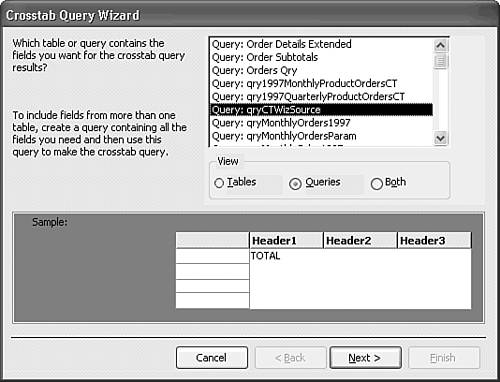 Double-click the ProductID column to move ProductID from the Available Fields to the Selected Fields list. Do the same for the ProductName column. The second Wizard dialog appears as shown in Figure 11.62. Click Next. Figure 11.62. Select the query columns to appear as row headers in the second Wizard dialog. 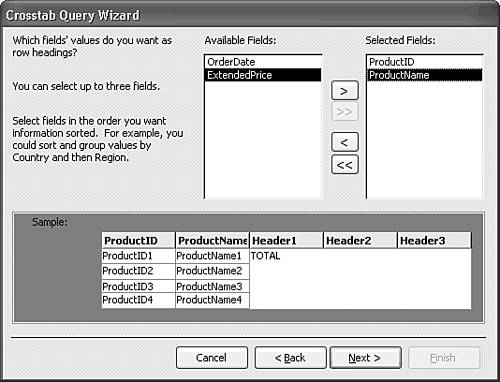 Accept the default OrderDate field for the column headings (see Figure 11.63). Click Next. Figure 11.63. Specify the query column that provides the column headers in the third Wizard dialog. 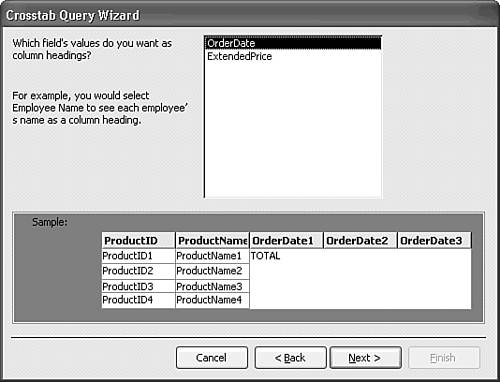 Select Quarter as the date interval for the columns (see Figure 11.64). Click Next. Figure 11.64. Specify the date interval in the fourth dialog's list. This dialog appears only if you specify a date field for row or column headings. 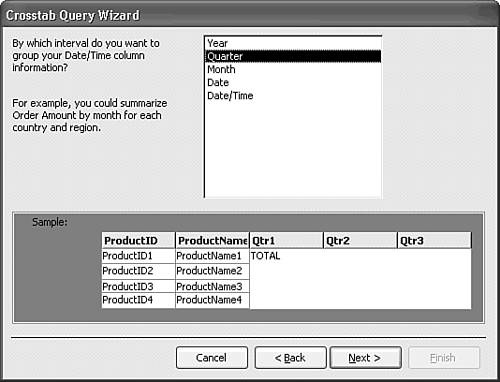 Select Sum as the aggregate function to total sales for each quarter. Leave the Yes, Include Row Sums check box marked to include a column that shows the total sales for the four quarters (see Figure 11.65). Click Next. Figure 11.65. You can specify any aggregate function to summarize the numeric data for the crosstab query. 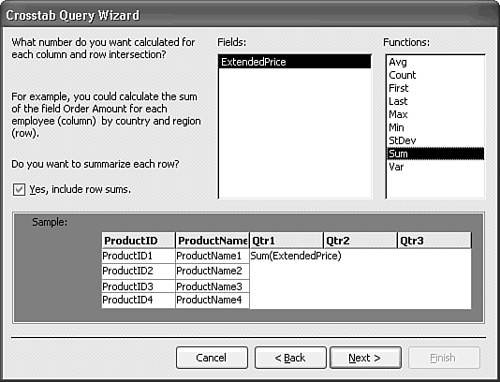 In the final Wizard dialog, type qry1997QuarterlyProductOrdersCT as the name of the query and click Finish to display the crosstab query result set (see Figure 11.66). Figure 11.66. The crosstab query has rows for each of the 77 products sold by Northwind traders. 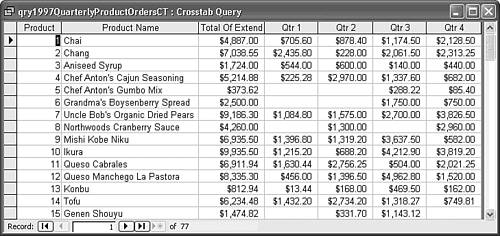  Change to Design view to check the query the Query Wizard based on the original qryCTWizSource query. Open the list in one of the cells of the added Crosstab row to view the choices for each field of the query (see Figure 11.67). Change to Design view to check the query the Query Wizard based on the original qryCTWizSource query. Open the list in one of the cells of the added Crosstab row to view the choices for each field of the query (see Figure 11.67).
Figure 11.67. Crosstab queries have an additional row, Crosstab, in the grid. 
The Crosstab row choices Row Heading, Column Heading, Value, and (Not Shown) determine the location of field values in the crosstab datasheet. Jet SQL  The Jet SQL statement for the crosstab query is The Jet SQL statement for the crosstab query is
TRANSFORM Sum(qryCTWizSource.ExtendedPrice) AS SumOfExtendedPrice SELECT qryCTWizSource.ProductID, qryCTWizSource.ProductName, Sum(qryCTWizSource.ExtendedPrice) AS [Total Of ExtendedPrice] FROM qryCTWizSource GROUP BY qryCTWizSource.ProductID, qryCTWizSource.ProductName PIVOT "Qtr" & Format([OrderDate],"q"); The Jet SQL PIVOT and TRANSFORM reserved words generate the crosstab query result set. The expression following TRANSFORM defines the numeric values for the matrix. The SELECT field list supplies the row headings and values. The PIVOT expression defines the column headings and acts as an extension to the GROUP BY expression. The "q" format string specifies a quarterly date interval. |
Designing a Monthly Product Sales Crosstab Query You can bypass the Query Wizard by manually designing a crosstab query from scratch. To create a typical crosstab query in Query Design view that displays products in rows and the monthly sales volume for each product in the corresponding columns, follow these steps: Open a new query and add the Products, Order Details, and Orders tables to the query. Drag the ProductID and ProductName fields from the Products table to the query's first two columns and then drag the OrderDate field of the Orders table to the third column. Choose Query, Crosstab Query. The title bar of the query changes from Query1: Select Query to Query1: Crosstab Query. The Crosstab row is added to the Query Design grid. Open the drop-down list of the ProductID column's Crosstab row and select Row Heading. Repeat this process for the ProductName column. These two columns provide the required row headings for your crosstab. A crosstab query must have at least one row heading. Open the Total drop-down list of the OrderDate column and select Where. Type Like "*/*/1997" in this column's Criteria row to restrict the query to orders received in 1997. Move to the next (empty) column's Field row and type the following: [View full width] Sales: Sum([Order Details].[Quantity]*[Order Details].[UnitPrice]*(1-[Order Details].  [Discount])) [Discount]))
Move to the Total row, choose Expression from the drop-down list, and then choose Value from the Crosstab row. The expression calculates the gross amount of the orders received for each product that populates your crosstab query's data cells. (You must specify the Orders Detail table name; if you don't, you receive an "Ambiguous field reference" error message.)  Click the Properties button to open the Field Properties window for the Sales column and select Currency as the Format property of the column. Click the Properties button to open the Field Properties window for the Sales column and select Currency as the Format property of the column.
In the next (empty) column's Field row, type Format([OrderDate], "mmm"). Access adds a default field name, Expr1:. Accept the default because the Format function that you added creates the column names, the three-letter abbreviation for the months of the year ("mmm" format), when you run the query. The months of the year (Jan through Dec) are your column headings, so move to the Crosstab row and choose Column Heading from the drop-down list. The design of your crosstab query appears as shown in Figure 11.68. Figure 11.68. This crosstab query design displays order amounts for products by month.  Click Run to execute the query (see Figure 11.69). Figure 11.69. The "mmm" format string for months sorts the columns by month name, not month number. 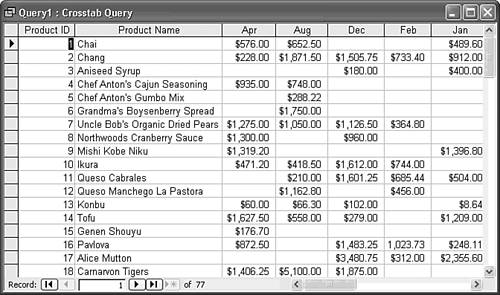
Notice that the crosstab query result contains a major defect: The columns are arranged alphabetically by month name rather than in calendar order. You can solve this problem by using fixed column headings, which you learn about in the following section. Using Fixed Column Headings with Crosstab Queries Access uses an alphabetical or numerical sort on row and column headings to establish the sequence of appearance in the crosstab query result table. For this reason, if you use short or full names for months, the sequence is in alphabetic rather than calendar order. You can correct this problem by assigning fixed column headings to the crosstab query. Follow these steps to modify and rerun the query: To review the ways Access lets you manipulate dates and time, see "Functions for Date and Time," p. 370.
Return to Query Design view and click the Properties button on the toolbar, or double-click an empty area in the Query Design window's upper pane. The Query Properties window contains an option that appears only for crosstab queries: Column Headings. In the Column Headings text box, type the three-letter abbreviations of all 12 months of the year. You must spell the abbreviations of the months correctly; data for months with spelling mistakes doesn't appear. You can separate entries with commas or semicolons, and you don't need to type quotation marks, because Access adds them (see Figure 11.70). Spaces are unnecessary between the Column Headings values. After you complete all 12 entries, close the Query Properties window. Figure 11.70. Add month names separated by semicolons to the Column Headings property of crosstab queries.  Click Run. Now the result table, shown in Figure 11.71, sorts the months in numeric order, although you can see only January through May in the figure. (Scroll to the right to see the remaining months.) Figure 11.71. Adding the fixed column headers eliminates the sorting problem with the month columns. 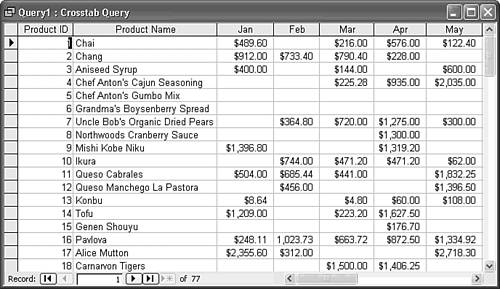 Tip If your crosstab datasheet differs from that of Figure 11.71, check whether you properly entered the fixed column headings in the Query Properties window. A misspelled month causes Access to omit the month from the query result set; if you specified "mmmm" instead of "mmm", only May appears. Choose File, Save As and save the query with an appropriate name, such as qry1997MonthlyProductOrdersCT.  You can produce a printed report quickly from the query by clicking the Print Preview button on the toolbar and then clicking the Print button. You can produce a printed report quickly from the query by clicking the Print Preview button on the toolbar and then clicking the Print button.
Tip You might want to use fixed column headings if you use the Group By instruction with country names. Users in the United States will probably place USA first, and Canadian firms will undoubtedly choose Canada as the first entry. If you add a record with a new country, you must remember to update the list of fixed column headings with the new country value. Fixed column headings have another hidden benefit: they usually make crosstab queries operate more quickly.
Jet SQL The Jet SQL statement for the crosstab query with fixed column headings is [View full width] TRANSFORM Sum([Order Details].[Quantity]*[Order Details]. [UnitPrice]* (1-[Order Details].[Discount])) AS Sales SELECT Products.ProductID, Products.ProductName FROM Orders INNER JOIN (Products INNER JOIN [Order Details] ON Products.ProductID = [Order Details].ProductID) ON Orders.OrderID = [Order Details].OrderID WHERE (((Orders.RequiredDate) Like "*/*/1997")) GROUP BY Products.ProductID, Products.ProductName PIVOT Format([OrderDate],"mmm") In("Jan","Feb","Mar","Apr","May","Jun", "Jul","Aug","Sep","Oct","Nov","Dec");
The only significant differences between the preceding SQL statement and that for the quarterly crosstab query is the lack of a grand total column for each product, the change of the date interval ("mmm" instead of "q"), and the addition of the In() function with the fixed column names list as its argument. If you want to add a grand totals column, add to the field list of the SELECT statement, Sum(Sales) AS [Total Orders], return to Design view, select the Grand Total column, and set its Format property to Currency. The added column appears in Figure 11.72. Figure 11.72. You can add a Total Orders column by adding Sum(Sales) AS [Total Orders] to the column list of the SELECT statement. You must specify the Currency format of the column in the Field Properties window. 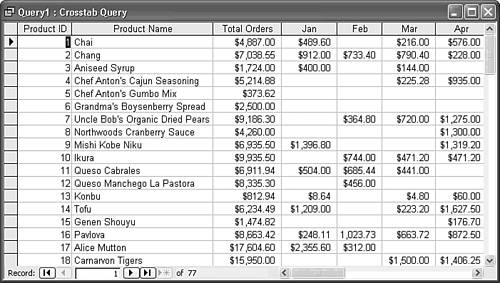 |
|