| Excel presents a real headache when you have some number of records in different categories, and not all categories have the same number of records. Figure 1.12 continues the example first shown in Figure 1.1. Figure 1.12. This is what a relational structure can look like when it gets shoehorned into a worksheet. 
Notice in Figure 1.12 that some rows repeat information: rows 834 through 837, for example, and rows 838 through 851. Rows that have the same value for the PO Number have the same PO Date, Vendor, Manager ID, and PO Amount in columns A through E. From Column F and on to the right, rows with the same PO Number might have different values, depending on the invoice's date, amount, and so on. This arrangement isn't as effective as another one might be. Look at all that repetition! All that's really needed to uniquely identify a purchase order is the PO number (assuming that the issuer takes the elementary precaution of avoiding duplicate PO numbers). Knowing the PO number tells you its issue date, the vendor's name, the manager's ID, and its amount. And yet, as vendors' invoices enter the system, this layout requires repetition so that the user can see all the pertinent information. For example, how would you know that a $5,000 invoice exceeded the original PO amount of $4,000 unless you could see both figures? The approach shown in Figure 1.12 assigns one row to each invoice, multiple rows to each PO, and one column to each field whether or not that field contains information concerning a PO or an invoice. Another way to approach the problem is to assign exactly one row to a PO and to string out information about the associated invoices in columns. Figure 1.13 shows one way of doing this. Figure 1.13. Instead of an indeterminate number of rows per PO, here you get an indeterminate number of columns. 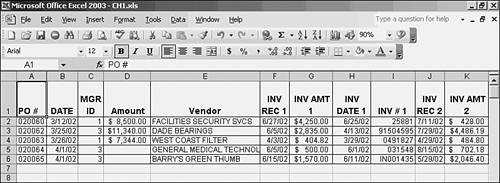
In one way at least, the layout shown in Figure 1.13 is better than that in Figure 1.12: It doesn't repeat the PO information for every invoice that references the same PO. But it introduces new drawbacks. One is that you can't sensibly get invoice amounts into a range of contiguous cells, such as G980:G995, where it's easy to total them. Instead, you have to create a formula that adds each cell separately for example =G970 + L970 + Q970 + V970 + AA970 . . .
and so forth until you reach the final possible invoice amount (yes, after you've created this formula it's easy to copy into new rows). More important, suppose that 14 columns are needed to completely describe an invoice. What happens when you get to the eighteenth invoice? With 17 invoices entered, you've used 243 columns: 238 for the invoice data plus 5 for the PO. That leaves 13 columns of the 256 on a worksheet, and you can enter only 17 invoices. Seventeen invoices might seem like plenty, but the worksheet from which Figure 1.12 was taken had 15 different purchase orders with more than 17 invoices each. And visually, a repeating sequence of columns is a nightmare. This gets us back to the problem discussed in the earlier section, "Transposing Rows and Columns." And if you switch rows and columns in this layout, distributing invoice records across columns instead of across rows, you deny yourself the list structure (records in rows, fields in columns) that is so useful in Excel. How, for example, would you go about charting invoice amount against invoice date given the layout in Figure 1.13? You'd have to create a chart using one pair of columns, and then add data to that chart from another pair of columns, and so on instead of creating the chart in a single step as a list layout would let you. Another approach might be to use different workbooks for different vendors, and a different worksheet within each workbook for each purchase order. That's a recipe for chaos. The root cause of the problem is that Excel is asked to account for three dimensions when only two are available. One dimension is purchase orders. Another is invoices, which are nested within each purchase order. The third dimension is the set of fields that describes a purchase order or an invoice; this set of fields crosses purchase orders and invoices. But a worksheet has two dimensions: rows and columns, and you can't represent purchase orders, invoices, and fields on a worksheet without distributing information across rows, as in Figure 1.12, or alternating fields across invoices so that it's impractical to do any charting or analysis, as in Figure 1.13. This is one of the reasons that relational databases are so useful: You use them to relate a set of child records (here, the invoices) to the parent records they belong to (here, the purchase orders). One major goal of this book is to show you how to harness the management power of a relational database to the analytic power of Excel, so that you can bring to bear the best of both applications. |