Implementing Instrumentation and Tracing
Instrumentation is the process of adding features to your applications that provide the ability to measure performance and to track and troubleshoot errors. There is a need during testing, as well as after the application is running in a production environment, to have some means of tracking how the application is performing and what type of errors are encountered. Instead of relying on users to report errors accurately, you can make use of the Trace classes to make sure that accurate information is recorded every time that an error occurs. This information can be written to a log file, or even the system event log, and reviewed periodically to make sure that your applications are running reliably and up to their specifications.
The .NET Framework offers a set of classes that enable you to easily add these features to your applications. This section covers how the Debug class differs from the familiar Visual Basic 6 Debug object and also covers the new .NET Framework Trace, TraceListener, BooleanSwitch, and TraceSwitch classes. These classes are all part of the System.Diagnostics namespace.
The Debug.Write and Trace.Write statements can be placed directly in your code at every point where you would like status information about what is happening at runtime. Output from the Debug.Write and Trace.Write statements is displayed in the Output window when you are running your application in the Visual Studio .NET IDE. The Output window is usually displayed when you start your application in Visual Studio .NET. You can access it by choosing View Ø Other Windows Ø Output from the Visual Studio .NET menu.
In general, it makes sense to use Debug.Write statements for your own information during testing and troubleshooting in the development phase. By default, Debug statements are not included in your compiled executable when you create a Release build.
Trace.Write statements can be added to your application to add permanent instrumentation to the compiled executable. The behavior of Trace statements can be controlled by using them in conjunction with TraceListeners and TraceSwitches.
The TraceListeners determine where the output from Trace.Write statements are directed at runtime (the console, a text file, or the event log).
TraceSwitches enable you to turn tracing on and off. You might not need to produce trace output every time your application runs, but only when a problem is reported and you need to troubleshoot. TraceSwitches can also have a priority level that determines whether all Trace.Write messages are output, or only those above the specified priority level. Settings for TraceSwitches can be made directly in your source code or in an application configuration file. Visual Studio .NET defines a standard XML format for the application configuration files. The application configuration file is created by Visual Studio .NET with default settings, you can customize these for your application. Using a configuration file also enables settings to be changed by an administrator as frequently as required after the application is deployed, without having to recompile and redistribute the application executables.
| Note | You will look at TraceListeners and TraceSwitches in more detail later in this chapter. |
If you want debugging and tracing code to be included in your compiled executables, the DEBUG compiler directive and the TRACE compiler directive must be set to True before compiling your application. When you are using Visual Studio .NET, these settings are handled automatically for you. When you build your application by using a Debug configuration (see the previous section, “Configuring the Debugging Environment,” for an explanation of Debug versus Release builds), both the DEBUG and TRACE directives will be set to True. When you change the configuration setting to create a Release build, only the TRACE directive will be enabled. If you would like to manage these settings yourself or to view the settings made by Visual Studio .NET, go to the project Property Pages dialog box (go to Project Ø Properties menu, click Configuration Properties, and then click Build). In this dialog box, you will see check boxes to enable either of the DEBUG and TRACE constants. Figure 8.6 shows the Project Properties dialog box displaying these choices.
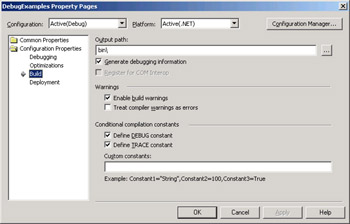
Figure 8.6: DEBUG and TRACE compiler directives in the project Property Pages dialog box
You can also control DEBUG and TRACE settings by declaring the constants at the top of your source code modules:
#Const DEBUG = True #Const TRACE = True
If you are not using Visual Studio .NET and are compiling by using the vbc.exe command-line compiler, you can use command-line switches to include or omit the tracing and debugging code in your executable (these settings are case sensitive):
C:\path\vbc.exe /r:System.dll /d:TRACE=TRUE /d:DEBUG=FALSE MySource.vb
Next, you will learn about the methods and properties of the Debug and Trace classes.
Writing Messages with Debug and Trace
Both the Debug class and the Trace class work the same way and have the same set of properties and methods. As discussed in the previous section, the main difference is that the Debug class is more suitable for providing information to the developer during development and testing using the Visual Studio .NET IDE. The Trace class is more suitable for permanently adding instrumentation to applications because Trace statements can be controlled by TraceSwitch settings. The properties and methods of the Debug and Trace classes are listed in Table 8.1.
| Property | Description |
|---|---|
| AutoFlush | Indicates whether the Flush method should be called on the listeners after every write |
| IndentLevel | Indicates the indent level |
| IndentSize | Indicates the number of spaces in an indent |
| Listeners | Provides access to the collection of listeners that is monitoring the trace output |
| Method | Description |
| Assert | Checks for a condition and displays a message if the condition is false |
| Close | Flushes the output buffer and then closes the listeners |
| Fail | Emits an error message |
| Flush | Flushes the output buffer and causes buffered data to be written to the listeners |
| Indent | Increases the current IndentLevel by one |
| Unindent | Decreases the current IndentLevel by one |
| Write | Writes information to the trace listeners in the Listeners collection. |
| WriteIf | Writes information to the trace listeners in the Listeners collection if a condition is true. |
| WriteLine | Writes information to the trace listeners in the Listeners collection |
| WriteLineIf | Writes information to the trace listeners in the Listeners collection if a condition is true |
As you can see, there are four variations of the Write method. Write simply outputs a text string. The WriteLine method outputs the string with a line-ending character at the end. The WriteIf method and the WriteLineIf method will produce output only if a specified conditional statement evaluates to True.
Output messages are written to the Output window in Visual Studio .NET and to all TraceListeners. The Write and WriteLine methods have overloaded constructors that can accept a single parameter (the message text) or two parameters (the message text and a category description). The WriteIf and WriteLineIf methods require either two or three parameters. The first parameter is always an expression that can resolve to a Boolean (True or False) result. Output messages will be written only if the expression resolves to True. Following that, you can specify a message, or a message and category description. The category descriptions and message text are left to the developer to define. You should plan and document the information that your debug and trace messages output, to best aid those who are responsible for the ongoing maintenance of your application.
Listing 8.1 shows some examples of outputting messages with the Debug and Trace classes.
Listing 8.1: Writing Debug and Trace Messages
Dim crucialValue As Integer = 5001 Debug.Write("Debug message") Trace.Write("Trace message") Debug.WriteLine("Debug message", "Category=GeneralError") Trace.WriteLine("Trace message", "Category=GeneralError") Debug.WriteIf(crucialValue >= 5000, "Debug message") Trace.WriteIf(crucialValue >= 5000, "Trace message") Debug.WriteLineIf(crucialValue >= 5000, "Debug message", _ "Category=GeneralError") Trace.WriteLineIf(crucialValue >= 5000, "Trace message", _ "Category=GeneralError")
Using Assertions
Both the Debug and Trace classes offer an Assert method. When you write an Assert statement, you provide an expression that you expect to evaluate to True, while your application is running as expected. Assertions are useful when debugging, because they enable your application to run normally and interrupt only if an expected value turns out to be false. When the test expression evaluates to False, the Assert method causes an error dialog box to be displayed, along with writing messages to the Output window. This is fine during the development and testing stages, but is not acceptable for a Release version of the executable.
Listing 8.2 is an example of code using a Debug.Assert statement to test an assertion while your application is running. Figure 8.7 shows the error message that is displayed when the Assert statement fails.
Listing 8.2: Using Assertions
Dim crucialValue As Integer = 1003 Trace.Assert(crucialValue <= 1000, "Crucial value has exceeded 1000")
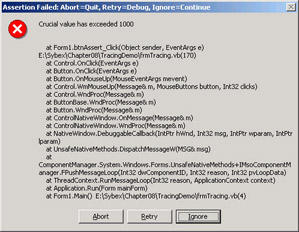
Figure 8.7: The message box that is displayed when an Assert method call fails
During application testing and debugging, the Trace.Assert method’s default behavior of displaying the detailed error message causing the debugger to go into Break mode is useful to developers. But if you would like the Assert statements to remain in your application and have the application run without interruption, then you can add an element to the <system.diagnostics> section of your application configuration file to disable the message box and send the output to a text file instead.
<assert assertuienabled="false" logfilename="C:\path\errorLog.txt"/>
After your Trace statements are in place, you can control their output by using TraceListeners and TraceSwitches. You will learn about these next.
Using TraceListeners
Now that you have seen how to add debug and trace messages to your code, let’s look at how to direct their output by using TraceListeners. There is a .NET Framework class called DefaultTraceListener that is automatically added to the Trace.Listeners collection. This is the mechanism that is responsible for writing to the Visual Studio .NET Output window, by default.
If you are using debug and trace messages only for development purposes, it is fine to allow these statements to display in the Output window and nowhere else. When you are adding Trace statements to your code that will remain for ongoing performance monitoring and troubleshooting, you will want to direct the output to a persistent store, such as a text file or, in some cases, to the Windows event log. TraceListeners provide this capability.
After you have added Trace or Debug Write statements (or any of the variations) to your application code, you should add one or more Trace.Listener objects to direct the output messages to the appropriate location. This location can be a text file or a Windows event log entry. When you are adding listeners to your application, you will choose one of the derived classes of the TraceListener class, the TextWriterTraceListener class or the EventLogTraceListener class.
The TextWriterTraceListener class can write output to any .NET Framework Stream object, such as a text file. The EventLogTraceListener class is designed to write to a Windows event log. To further customize your application’s tracing capability, you can inherit from the TraceListener class and override its methods to create a custom output source for your trace messages.
| Note | Custom TraceListeners are outside the scope of the 70-310 exam and this book. |
Here are some code examples showing how to create standard TraceListeners. First the TextWriterTraceListener:
Dim myFileWriter As New TextWriterTraceListener("c:\path\errorLog.txt") Trace.Listeners.Add(myFileWriter) The constructor method creates the TextWriterTraceListener and assigns a filename that it should write to. The second line of code adds the new listener to the Listeners collection. This is important because unless the listener is added to the collection, it will not receive the trace messages.
During application execution, the TextWriterTraceListener holds trace messages in its buffer. To cause this information to be written to the specified text file, you must call the Flush method, usually at the end of a procedure that includes trace messages. At the end of application execution, you can call the Close method to release the file. Here is an example:
myFileWriter.Flush() myFileWriter.Close()
The EventLogTraceListener will write to a Windows event log. By default, it uses the application log. You can add a source name for event log entries when you create the listener. This is usually the application or component name (in the following example, you are using TracingApp). This will show up in the event log in the Source column. This code adds an EventLogTraceListener to your application:
Dim myLogger As EventLogTraceListener = New EventLogTraceListener("TracingApp") Trace.Listeners.Add(myLogger) Table 8.2 lists the properties and methods available for TraceListeners.
| Property | Description |
|---|---|
| IndentLevel | The indent level |
| IndentSize | The number of spaces in an indent |
| Name | The name for this TraceListener |
| EventLog | The EventLog object to write output to (EventLogTraceListener only) |
| Writer | The TextWriter object to write output to (TextWriterTraceListener only) |
| Method | Description |
| Close | Closes the output stream so it no longer receives tracing or debugging output |
| Fail | Sends error messages to the listener |
| Flush | When overridden in a derived class, flushes the output buffer |
| Write | Writes a message and category name to the listener |
| WriteLine | Writes a message and category name to the listener, followed by a line terminator |
TraceListeners are important because they direct the output from your debug and trace messages to a persistent source, rather than just the Visual Studio .NET Output window. If you add more than one listener to the Listeners collection, messages will be sent to all listeners.
Using TraceSwitches
Although trace output is useful in monitoring your applications, when everything is running satisfactorily, you might prefer to turn off the trace messages to improve application performance. TraceSwitches enable you to manage the settings that determine when trace output is created via configuration files.
There are two types of trace switches: the BooleanSwitch class and the TraceSwitch class. The BooleanSwitch class has a simple on/off behavior. The TraceSwitch class can be set to one of five levels; output is produced only when a conditional test shows that the level is appropriate.
A setting of 0 (zero) means that the switch is set to Off (the available settings for the Level property are listed in Table 8.4). A setting of 1 means that only the most severe error messages should be output. The remaining three settings enable you to further categorize your messages as to their priority level. When you set the Level property to a setting of 2 or higher, the TraceListeners will output all messages of that level or lower. That is, a setting of 2 will cause both error and warning messages to be output, whereas a setting of 4 will cause all messages in your application to be output.
TraceSwitches have no unique methods (other than those inherited from the System.Object class, such as ToString, and supported by all .NET Framework classes), so Table 8.3 lists only properties. Table 8.4 lists the enumerated values that are used to set the TraceSwitch.Level property.
| Property Inherited from the Switch Class | Description |
|---|---|
| Description | A description of the switch |
| DisplayName | A name used to identify the switch (in configuration files) |
| Property of the BooleanSwitch Class | Description |
| Enabled | Specifies whether the switch is enabled or disabled |
| Property of the TraceSwitch Class | Description |
| Level | Indicates the trace level that specifies the messages to output for tracing and debugging |
| TraceError | Indicates whether the Level property is set to Error, Warning, Info, or Verbose |
| TraceInfo | Indicates whether the Level property is set to Info or Verbose |
| TraceVerbose | Indicates whether the Level property is set to Verbose |
| TraceWarning | Indicates whether the Level property is set to Warning, Info, or Verbose |
| Setting | Integer | Type of Message Output |
|---|---|---|
| Off | 0 | None (the switch is Off) |
| Error | 1 | Only error messages |
| Warning | 2 | Warning messages and error messages |
| Info | 3 | Informational messages, warning messages, and error messages |
| Verbose | 4 | Verbose messages, informational messages, warning messages, and error messages |
TraceSwitches are usually declared at the class level, like this:
Private boolSwitch As New BooleanSwitch( _ "BSwitch", "TestCode") Private lvlSwitch As New TraceSwitch( _ "LSwitch", "TestCode")
It is possible to include the switch settings in your source code, as shown here:
boolSwitch.Enabled = False lvlSwitch.Level = TraceLevel.Warning
However, using the application configuration file to manage the settings gives you more flexibility in adjusting your tracing behavior after the application has been deployed. The advantage of using the configuration file is that an administrator can change the settings whenever needed, without having to request a change to the source code and having to reinstall the application.
Notice that in the configuration file, you will refer to the switch by the name that was specified when you instantiated the switch. The name is the first argument that you supplied to the constructor method, in the preceding code snippet. Here is an example of using an XML configuration file to make the same settings as shown in the code snippet.
Private boolSwitch As New BooleanSwitch( _ "BSwitch", "TestCode") Private lvlSwitch As New TraceSwitch( _ "LSwitch", "TestCode") <configuration> <system.diagnostics> <switches> <add name="BSwitch" value="0" /> <add name="LSwitch" value="2" /> </switches> </system.diagnostics> </configuration>
If you will be using TraceSwitches with your application, you will need to write your Trace statements differently from the simple examples that you have seen so far. Before each message is output, your code should test either the BooleanSwitch.Enabled property or the TraceSwitch.Level property to see whether it is appropriate to write the message based on the current settings in the configuration file. This can be done with the WriteIf and WriteLineIf methods of the Trace object, or just by wrapping your Trace statement in an If block.
Here is an example of using WriteLineIf to test whether the BooleanSwitch is enabled and the TraceSwitch is set to level 1:
Trace.WriteLineIf(boolSwitch.Enabled, "Trace message") Trace.WriteLineIf(lvlSwitch.TraceWarning, _ "An event of Error or Warning status has occurred")
Here is similar code using If blocks:
If boolSwitch.Enabled Then Trace.WriteLine("Trace message") End If If lvlSwitch.TraceWarning Then Trace.WriteLine( _ "An event of Error or Warning status has occurred ") End If | Tip | Using the WriteIf and WriteLineIf methods can incur performance overhead in your application. This is because both arguments of the method (both the property test and the message itself) must be evaluated when the statement is encountered. If the property test indicates that tracing is not required at this time, any work that was done to evaluate the second argument would have been unnecessary. If your second argument (the message) is complex, this might cause noticeable performance delays. To avoid this problem, use the explicit If blocks in your code. |
In Exercise 8.2, you will write trace messages to log files and the Windows application event log. You will learn how to add TraceSwitches to control when output is produced and how to change these settings in an application configuration file.
Exercise 8.2: Instrumenting Your Application with Tracing
Creating and Using TraceListeners:
-
Start Visual Studio .NET and begin a new Windows application. Name the project TracingDemo.
-
Change the name of the default Form1.vb to frmTracing.vb.
-
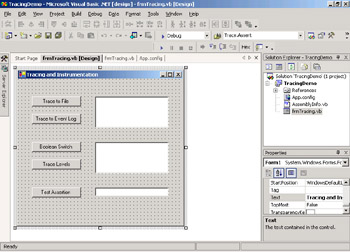
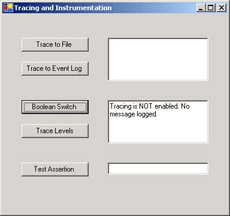
Add five Command Buttons—btnTextTrace, btnEventLog, btnBoolSwitch, btnLevel, and btnAssert—and three TextBoxes—txtMessage (set the Multiline property to True), txtMessage2 (set the Multiline property to True), and txtAssertValue—to the form. Your form should look like the following one.
-
Double-click the Trace To File button to create a Click event procedure in the code module. You will add code to this procedure to create and use a TextWriterTraceListener (when setting the path and filename for the errorLog.txt file, use an appropriate directory on your computer):
Private Sub btnTextTrace_Click(ByVal sender As System.Object, _ ByVal e As System.EventArgs) Handles btnTextTrace.Click Dim myLogFile As String = "C:\path\errorLog.txt" Dim myFileWriter As New TextWriterTraceListener(myLogFile) Trace.Listeners.Add(myFileWriter) Trace.WriteLine("Log error into a text file " & Now()) txtMessage.Text = _ "Message has been logged check the text file: " & _ Environment.NewLine & myLogFile myFileWriter.Flush() myFileWriter.Close() Trace.Listeners.Remove(myFileWriter) End Sub -
Create a Click event procedure for btnEventLog. You will add code to this procedure to create and use an EventLogTraceListener:
Private Sub btnEventLog_Click(ByVal sender As System.Object, _ ByVal e As System.EventArgs) Handles btnEventLog.Click Dim myLogger As EventLogTraceListener = New _ EventLogTraceListener("TracingApp") Trace.Listeners.Add(myLogger) Trace.WriteLine("Log error to the event log " & Now()) txtMessage.Text = _ "Message has been logged check the Application Event Log" Trace.Listeners.Remove(myLogger) End Sub -
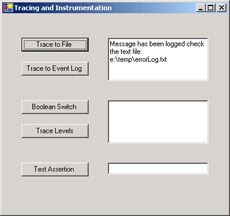
Save and test your work. Click the Trace To File button. You should see a confirmation message in the text box. Click the button a few more times. The application should look like the following.
-
Use Windows Explorer to locate the directory that you specified for the errorLog.txt file. Open this file in Notepad and review the contents. You should see the messages that were produced by the Trace.WriteLine method:
Log error into a text file 3/11/2003 9:53:27 AM Log error into a text file 3/11/2003 9:53:28 AM Log error into a text file 3/11/2003 9:53:30 AM Log error into a text file 3/11/2003 9:53:31 AM
-
Now click the Trace To Event Log button. You should see a confirmation message in the text box. Access the Windows Event Viewer by choosing Start Ø Programs Ø Administrative Tools Ø Event Viewer (or the equivalent procedure for your operating system version). Select the Application Log. You should see an entry with TracingApp in the Source column. This was the name that you assigned to the EventLogTraceListener in the code in step 5.
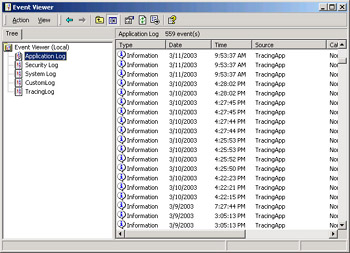
-
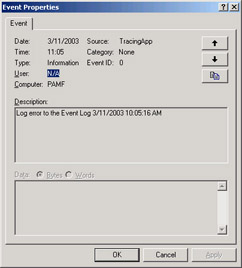
Double-click the entry to open the Event Properties dialog box and see the message produced by the Trace.WriteLine method in the Description field.
Creating and Using TraceSwitches:
-
Create two class-level variables to declare and instantiate a BooleanSwitch and a TraceSwitch. Notice that the first argument in each case is the name that you are assigning to the switch; this is how you refer to it in the configuration file. The second argument is a description.
-
Here is the code to do this:
Private boolSwitch As New BooleanSwitch("BSwitch", "TestCode") Private lvlSwitch As New TraceSwitch("LSwitch", "TestCode") -
Create a Click event procedure for btnBoolSwitch. You will add code to this procedure to create and use a BooleanSwitch:
Private Sub btnBoolSwitch_Click(ByVal sender As System.Object, _ ByVal e As System.EventArgs) Handles btnBoolSwitch.Click Dim myLogFile As String = "C:\path\errorLog.txt" Dim myFileWriter As New TextWriterTraceListener(myLogFile) Trace.Listeners.Add(myFileWriter) If boolSwitch.Enabled = True Then Trace.WriteLine("Log error into a text file " & _ "when tracing is enabled " & Now()) txtMessage2.Text = "Tracing is enabled. " & _ "Message has been logged, " & _ "check the text file: " & _ Environment.NewLine & myLogFile Else txtMessage2.Text = "Tracing is NOT enabled. " & _ "No message logged." End If myFileWriter.Flush() myFileWriter.Close() Trace.Listeners.Remove(myFileWriter) End Sub -
Create a Click event procedure for btnLevel. You will add code to this procedure to create and use a TraceSwitch:
Private Sub btnLevel_Click(ByVal sender As System.Object, _ ByVal e As System.EventArgs) Handles btnLevel.Click Dim myLogFile As String = "C:\path\errorLog.txt" Dim myFileWriter As New TextWriterTraceListener(myLogFile) Trace.Listeners.Add(myFileWriter) If lvlSwitch.Level = TraceLevel.Warning Then Trace.WriteLine("Log error into a text file when Level " & _ "is greater than 2 (Warning) " & Now()) txtMessage2.Text = "Level is 2 or greater. " & _ "Message has been logged, check the text file: " & _ Environment.NewLine & myLogFile Else txtMessage2.Text = "Level is less than 2 (Warning). " & _ "No message logged." End If myFileWriter.Flush() myFileWriter.Close() Trace.Listeners.Remove(myFileWriter) End Sub -
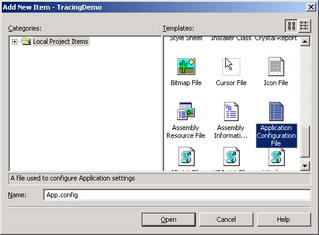
Add an application configuration file to your project. Right-click the project name in the Solution Explorer and choose Add Ø Add a New Item from the menu. Select Application Configuration File from the Add New Item dialog box.
-
Review this file in Visual Studio .NET and you will see only the XML declaration and <configuration> tags:
<?xml version="1.0" encoding="utf-8" ?> <configuration> </configuration>
-
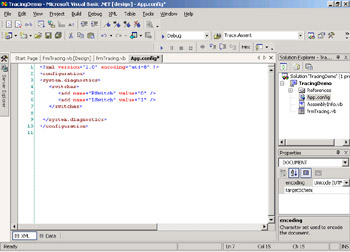
Add a <system.diagnostics> section and <switches> section to this file:
<?xml version="1.0" encoding="utf-8" ?> <configuration> <system.diagnostics> <switches> <add name="BSwitch" value="0" /> <add name="LSwitch" value="1" /> </switches> </system.diagnostics> </configuration>
-
Remember that the XML element and attribute names in the configuration file are case sensitive and must be typed exactly as shown. Otherwise, you will get an error when you try to run the project. Notice that you are adding two switches, using the names that were assigned in your code when you instantiated the objects: BSwitch and LSwitch. You are setting the value of BSwitch to zero (0), which means that the switch is not enabled for your application. You are setting the value of the second switch to 1, which indicates a level of Error.
-
Save and test your work. When you build the project, a file called TracingDemo.exe.config will be created in the \bin subdirectory of your project directory.
-
Run the application and click the Boolean Switch button. Because you have set BSwitch as not enabled, the Trace.WriteLine method will be skipped. You will see a message in the text box that tracing is not enabled.
-
Click the Trace Levels button—you have set the level for this switch to 1 (Error) in the configuration, and your code tests for a level of 2 (Warning). So the Trace.WriteLine method is skipped. The message in the text box confirms this.
-
Stop the application. In the application configuration file, change the value of BSwitch to 1 and the value of LSwitch to 2 (or higher). Run the application again and click the buttons. You should see messages in the text box confirming that the error was logged.
-
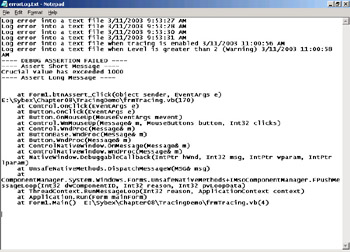
Use Windows Explorer to open the errorLog.txt file in Notepad and review the contents. You should see messages similar to these added to the file:
Log error into a text file when tracing is enabled 3/11/2003 11:00:56 AM Log error into a text file when Level is greater than 2 (Warning) 3/11/2003 11:00:58 AM
Testing Assertions:
-
Create a Click event procedure for btnAssert. You will add code to this procedure to create and test a Trace.Assert statement:
Private Sub btnAssert_Click(ByVal sender As System.Object, _ ByVal e As System.EventArgs) Handles btnAssert.Click Dim crucialValue As Integer = CType(txtAssertValue.Text, Integer) Trace.Assert(crucialValue <= 1000, _ "Crucial value has exceeded 1000") End Sub
-
Save and test your work. Run the application. Type a number greater than 1000 into the txtAssertValue text box and click the Test Assertion button. Because your Trace.Assert statement tests for a value that is less than or equal to 1000, the assertion will fail. You will see a message box with the assert error message. Close the application.

-
In the application configuration file, add a new element to control how the Trace.Assert error messages are displayed. Your application configuration file should look like this (the line shown in bold is the line you need to add here):
<?xml version="1.0" encoding="utf-8" ?> <configuration> <system.diagnostics> <switches> <add name="BSwitch" value="1" /> <add name="LSwitch" value="2" /> </switches> <assert assertuienabled="false" logfilename="C:\path\errorLog.txt"/> </system.diagnostics> </configuration>
-
Save and test your work. Run the application again, type in a value greater than 1000, and click the Test Assertion button. This time your application will not be interrupted. Use Windows Explorer to open errorLog.txt in Notepad and examine the contents. You should see output added to the file that provides the same information that was displayed in the message box in step 22.
EAN: 2147483647
Pages: 153