Appendix A: TruCluster Server Troubleshooting
Here, we take a look at problems we've seen and offer advice on what to do if you see them.
A.1. Troubleshooting
A.1.1 System/Cluster is Hung (or Appears Hung)
-
Are there CNX messages indicating lost quorum? (Check /var/adm/messages.)
If so, follow Chapter 17 suggestions for restoring quorum.
-
Do the members respond to ping(8)?
If not, the member(s) may be hung or suspended: force a crash (see section A.1.2).
-
Try logging in as root at the console.
If you can, check resources (memory, CPU, I/O, CFS) to see if something is swamped. Also check event logs and the console log.
A.1.2 System/Cluster is Hung II
If a single member is truly hung (doesn't respond to ping, you can't login at the console, no interactive processes are responding, etc.), you probably need to force a crash on the hung member (it could also be affecting the performance or responsiveness of the rest of the cluster). To do this:
-
Use the dumpsys(8) command on each responding member to copy a snapshot of memory to a dump file. By default, the dumpsys command writes the dump to /var/adm/crash, which is a CDSL to /cluster/members/{memb}/adm/crash.
# dumpsys Saving /var/adm/crash/vmzcore.0
-
Use clu_quorum to make sure the cluster will not lose quorum when you halt the hung member. (Reference Chapter 17.)
-
Crash the hung member by manually halting the member and running "crash" at the console prompt.
>>> crash
-
Boot the previously hung member. During boot, savecore(8) runs and captures the dump in /var/adm/crash. If the system won't boot, try booting to single-user and collect the crash files manually:
# /sbin/bcheckrc # /sbin/init.d/savecore # /sbin/init.d/crashdc
This should create the crash files in the default location (/var/adm/crash).
You should send the crash files to HP Support for analysis.
A.1.3 System is Running Slowly
If your cluster member(s) is running slowly, you should run the usual tools to try and identify the subsystem and, if possible, the specific offending element much like on a standalone system.
-
vmstat(1)
You should have healthy idle time (usually non-zero), zero or near zero pageouts, and healthy free list size (greater than the vm_page_free_target – "sysconfig –q vm vm_page_free_target").
-
netstat(1)
Look for heavy activity and especially collisions (if Ethernet). Collisions greater than 10% of traffic are usually a bad sign, but this is not a hard and fast rule.
-
collect(8)
Use collect for just about all of your performance gathering needs, but the I/O stats are particularly helpful. Watch for any disks getting overwhelmed. What is considered overwhelmed? That's outside the scope of this book, but it's a factor of the HBA, storage subsystem, and individual disk(s) themselves. Historical data is also a good guide to see if disks (or anything else for that matter) are being exhausted more than usual.
# collect -s d Initializing (10.0 seconds) ... done. #### RECORD 1 (1032229234:0) (Mon Sep 16 22:20:34 2002) #### # DISK Statistics #DSK NAME B/T/L R/S RKB/S W/S WKB/S AVS AVW ACTQ WTQ %BSY 0 cdrom0 0/5/0 0 0 0 0 0.00 0.00 0.00 0.00 0.00 1 dsk0 1/0/0 0 0 0 0 13.33 0.00 0.00 0.00 0.10 2 dsk9 2/0/1 0 0 0 0 0.00 0.00 0.00 0.00 0.00 3 dsk10 2/0/2 0 0 0 0 0.00 0.00 0.00 0.00 0.00 4 dsk11 2/0/3 0 0 0 0 0.00 0.00 0.00 0.00 0.00 5 dsk12 2/0/4 0 0 0 0 0.00 0.00 0.00 0.00 0.00 6 dsk13 2/0/5 0 0 0 0 0.00 0.00 0.00 0.00 0.00 7 dsk14 2/0/6 0 0 0 0 0.00 0.00 0.00 0.00 0.00 8 dsk1 2/1/0 3 139 0 0 21.37 0.00 0.07 0.00 5.49 9 dsk2 2/1/1 15 1943 0 1 22.83 0.00 0.36 0.00 21.47 10 dsk3 2/1/2 0 0 0 0 0.00 0.00 0.00 0.00 0.00 11 dsk4 2/1/3 0 0 0 0 0.00 0.00 0.00 0.00 0.00 12 dsk5 2/1/4 0 0 0 0 0.00 0.00 0.00 0.00 0.00 13 dsk6 2/1/5 2 170 0 0 30.42 0.00 0.08 0.00 6.69 14 dsk7 2/1/6 0 0 0 0 17.50 0.00 0.01 0.00 0.70 15 dsk8 2/1/7 0 0 0 0 0.00 0.00 0.00 0.00 0.00 16 dsk18 2/2/0 0 0 0 0 0.00 0.00 0.00 0.00 0.00 17 dsk19 2/2/1 0 0 0 0 0.00 0.00 0.00 0.00 0.00 18 dsk20 2/2/2 0 0 0 0 0.00 0.00 0.00 0.00 0.00
In this case, dsk2 is getting some activity, but it isn't bad: 21.47% BSY (busy).
-
ps(1)
This command lists the current processes. If the performance problem is a single process, you'll get a good idea of that from this output. Using the "pcpu" keyword, you can see the current top CPU users.
# ps -eo pcpu,cputime,user,pid,comm | sort -r | head %CPU TIME USER PID COMMAND 5.2 16:40.18 monbot 1132662 monbot-2.3.7 4.4 11:54:07 gry 1168434 xl8tl33tsp34Kd 1.3 0:00.04 root 1138862 rshd 0.6 02:46:58 root 1048576 kernel idle 0.2 13:31.87 aey 1049022 more README 0.0 9:17.01 root 1048808 evmd 0.0 5:21.51 cjy 1052689 telnet justice 0.0 3:04.06 root 1048692 update 0.0 2:32.01 bly 1052606 ksh
We might have used "ps aux | head" here but the formatted output was difficult to read. You can use either command or roll your own.
-
evmget(1)
Using the EVM_SHOW_TEMPLATE, you can a define the information that is returned from the evmget, evmwatch(1), evmsort(1), and evmshow(1) commands.
# export EVM_SHOW_TEMPLATE=\ > "@timestamp (@event_id)\n[@priority] @name\n@@\n"
There are two cluster-related filter template files in the /usr/share/evm/filters directory as shown by the evf script that we wrote.
# ./evf -vd /usr/share/evm/filters clu caa /usr/share/evm/filters clu.evf @clu:clu -> [name sys.unix.clu] @clu:cfs -> [name sys.unix.clu.cfs] @clu:cnx -> [name sys.unix.clu.cnx] @clu:drd -> [name sys.unix.clu.drd] @clu:member -> [name sys.unix.clu.member] @clu:shutdown -> [name sys.unix.clu.shutdown] @clu:wall -> [name sys.unix.clu.wall] @clu:caa -> [name sys.unix.clu.caa] @clu:clua -> [name sys.unix.clu.clua] caa.evf @caa:caa -> [name sys.unix.clu.caa] @caa:app -> [name sys.unix.clu.caa.app] @caa:cli -> [name sys.unix.clu.caa.cli] @caa:err -> [name sys.unix.clu.caa.err] @caa:res -> [name sys.unix.clu.caa.res]
By setting the EVM_SHOW_TEMPLATE and using the "@clu" filter, you can retrieve all cluster-related events that have occurred using the following evmget command.
# evmget -A -f @clu 29-Aug-2002 01:55:24 (13) [200] sys.unix.clu.cnx.quorum.gain CNX MGR: Node has (re)gained quorum (current votes 2, quorum votes 2) ...
When troubleshooting, it is often useful to cast a wide net and then draw it tight as appropriate (perhaps limiting the events to a specific time period); for example, to return all events that have occurred in the last two hours:
# evmget -A -f "[age < 2h]" 29-Aug-2002 03:36:14 (968) [200] sys.unix.clu.drd.new_accessnode._hwid.105 DRD: Server molari selected for device 105 ...
Once you find an event of interest, you can get more information by using the evmshow command with the "-d" option.
A.1.4 Parsing Events
Taking the event ID from the previous example, we can get more information as follows:
# evmget -f "[event_id = 968]" | evmshow -d ============================ EVM Log event =========================== EVM event name: sys.unix.clu.drd.new_accessnode._hwid.105 This event is posted by a DRD client to indicate that it has selected a server as a new access node for the specified device. ====================================================================== Formatted Message: DRD: Server molari selected for device 105 Event Data Items: Event Name : sys.unix.clu.drd.new_accessnode._hwid.105 Cluster Event : True Priority : 200 PID : 1061550 PPID : 1061518 Event Id : 968 Member Id : 2 Timestamp : 29-Aug-2002 03:36:14 Host IP address : 192.168.0.69 Cluster IP address : 192.168.0.70 Host Name : sheridan.dec.com Cluster Name : babylon5 Format : DRD : Server $server_name selected for device $_hwid Reference : cat:evmexp_clu.cat Variable Items: disk_type (STRING) = "SERVED" server_name (STRING) = "molari" _hwid (INT64) = 105 reason_code (INT32) = 0 ======================================================================
If the event you are focusing on happens to be a binlog event, the "evmshow –d" command will translate the event's binary information via DECevent (V5.0A, V5.1, and V5.1A) or Compaq Analyze (on V5.1B, if installed).
A.1.5 The "mc_diag –d" Command
In Chapter 4, we discussed using the mc_cable and mc_diag SRM console commands to verify that the Memory Channel hardware is functioning. In this section, we will discuss how to get additional diagnostic information (while at the console prompt) from the Memory Channel by using the mc_diag command with the "-d" option.
The "mc_diag –d" command displays eight fields of information:
-
Link Control and Status Register (LCSR)
-
Memory Channel Error Register (MCERR)
-
Memory Channel Port Register (MCPORT)
-
Cluster Interconnect Receive (from Memory Channel) Base Address Register (PRBAR)
-
PCI Status and Control Register (CFG04)
-
Configuration Longword (10H) Register (CFG10)
-
Module Configuration Register (MODCFG) – Memory Channel 2 ONLY
-
Port Online Status Register (POS) – Memory Channel 2 ONLY
You can obtain (or decode) information about the Memory Channel card's configuration from the output.
A.1.5.1 Standard Hub or Virtual Hub?
For example, you can determine if the card is configured in standard or virtual hub mode by looking at bit 2 of the LCSR field. If the card is in virtual hub mode, then looking at bit 31 of the MCPORT field will indicate VH0 or VH1 mode while bits 21:16 will indicate the node ID (or hub slot location in standard hub mode). See Figure A-1, Figure A-2, Figure A-3, and Figure A-4.
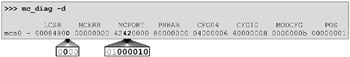
Figure A-1: Memory Channel 2 Hub Configuration, Node ID 2 (Hub Slot 2)
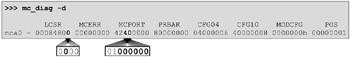
Figure A-2: Memory Channel 2 Hub Configuration, Node ID 0 (Hub Slot 0)
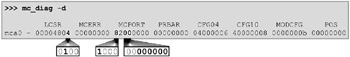
Figure A-3: Memory Channel 2 Virtual Hub Configuration, VH0
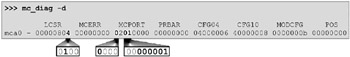
Figure A-4: Memory Channel 2 Virtual Hub Configuration, VH1
| Note | In a dual-redundant Memory Channel configuration, each card in the same system should be jumpered similarly. See section 4.4.1 for more information on configuring the Memory Channel. |
A.1.5.2 Memory Channel Address Space Window Size
In order for redundant Memory Channel rails to function with 512MB address space window size, each Memory Channel must be located in separate PCI buses. You can use the "show config" command to determine the location of the Memory Channel cards.
P00>>>show config ... Bus 00 Slot 08: DEC PCI MC mca0.0.0.8.0 Rev: 22, mca0 ... Bus 01 Slot 03: DEC PCI MC mca1.1.0.3.0 Rev: 22, mca1 ...
How can you determine the address space window size without looking at the card? Bit 2 of the MODCFG field indicates memory widow size. If bit 2 is not set, the address space window size is 512MB. See Figure A-5.
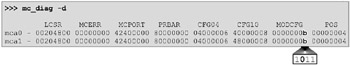
Figure A-5: Memory Channel 2 Memory Window Size of 512MB
A.1.5.3 The MCERR Field
The MCERR field should always be zeroes. However, a non-zero MCERR field is not necessarily fatal. We have seen an instance where the Memory Channel on a DS10 system does not complete its power-up self-test before the SRM console is ready. If this happens, run the init command, which should clear the problem. If it does not clear the error, you can cycle power on the system. As a last resort to clear the error before logging a call with HP, power off the system and reseat the card.
For more information on the "mc_diag –d" bit fields, see Chapter 3 (Troubleshooting) of the Memory Channel Service Information Guide, which shipped with your Memory Channel hardware. The guide also contains additional tips for troubleshooting the Memory Channel hardware as well.
A.1.6 CNX Problems (quorum, CNX boot hangs, etc.)
If you experience quorum problems or the cluster seems to hang and CNX messages are displayed on the console, try setting the sysconfig debug values in cnx:msg_level (default 1) and cnx:debug_msg_level (default 0) each to 5 either at boot time (by modifying /etc/sysconfigtab) or in real time using "sysconfig –r cnx <attribute>=5". These settings cause more verbose CNX messages to be logged to the console, /var/adm/messages and /var/adm/syslog.dated/current/kern.log, and can help you or HP Support with additional clues about the CNX behavior in your cluster.
A.1.7 Unable to See Your Shared Storage from Your Cluster Members
This is usually a persistent reservation problem and should only happen in isolated situations. Refer back to sections 15.13 and 22.5 for details about I/O Barriers and when they might get in your way. You can check for persistent reservations from the perspective of the cluster with "cleanPR show":
# cleanPR show cleanPR Version: 1.5 ... Checking device 5 1 100 Key Entry 0: 0x30001 Key Entry 1: 0x30002 Key Entry 1: 0x30002 Key Entry 3: 0x30001 Key Entry 6: 0x30001 Key Entry 6: 0x30002 Key Entry 6: 0x30001 Key Entry 6: 0x30002 ... Total of 5 devices found w/Persistent Reservations Total of 0 devices cleared of Persistent Reservations
You can also check the devices on your storage controller (HSG80> show <unit>) to see if they are listed as "persistent reserved" under "State" in the output.
HSG80> show d100 LUN Uses Used by ------------------------------------------------------------------------------ D100 DISK30100 LUN ID: 6000-1FE1-000B-1A40-0009-0361-3888-0062 NOIDENTIFIER Switches: RUN NOWRITE_PROTECT READ_CACHE READAHEAD_CACHE WRITEBACK_CACHE MAX_READ_CACHED_TRANSFER_SIZE = 32 MAX_WRITE_CACHED_TRANSFER_SIZE = 32 Access: ALL State: ONLINE to this controller Persistent reserved NOPREFERRED_PATH Size: 17769177 blocks Geometry (C/H/S): ( 5258 / 20 / 169 )
If you find that indeed there are persistent reservations on your storage, you can boot the Emergency Repair Disk (which means shutting down the cluster) and use the "cleanPR clean" command to clear all the persistent reservations.
# cleanPR clean cleanPR Version: 1.5 WARNING This shell script will clear all Persistent Reservations from the HSX80 devices attached to this system. WARNING Do you wish to proceed ? <y/n> [n]: y Removing Persistent Reservations from all HSX80 devices... Checking HSG80 at /dev/rdisk/dsk108a (SCSI #5 (SCSI ID #2) (SCSI LUN #100)) Checking HSG80 at /dev/rdisk/dsk6a (SCSI #5 (SCSI ID #9) (SCSI LUN #15)) Total of 0 devices found w/Persistent Reservations Total of 0 devices cleared of Persistent Reservations
If the "cleanPR clean" command doesn't resolve all the PRs, you can run the scu command manually to clear them.
# scu scu> set nexus bus 2 target 0 lun 3 scu> preserve clear
| Warning | Never clear persistent reservations from a cluster member! You will remove needed reservations. Always shut down the cluster and boot a standalone version of the OS, such as the Emergency Repair Disk, if you need to run the "cleanPR clean" command or if you need to use "scu" to clean them manually. |
A.1.8 Upgrading the KGPSA Firmware Causes HOST_ID Changes
After upgrading the firmware on the KGPSA host bus adapter, the HOST_ID connection for the KGPSA may change. If this happens, any storage accessed through it that is isolated using selective storage presentation (SSP) at the HSG80 seems to "disappear." The reason it seems to disappear is that we use the HOST_ID to configure the connections at the HSG80 (when using SSP). If the HOST_ID changes, the SSP settings no longer apply since the connection names are different. For example, consider one such connection:
Before the firmware update:
HSG80> SHOW CONNECTION Connection Name Operating system Controller Port Address Status Offset UNIX01 TRU64 UNIX THIS 2 000008 OL this 00 HOST_ID=1000-0000-C123-ABCD ADAPTER_ID=1000-0000-C123-ABCD
After the firmware update:
HSG80> SHOW CONNECTION Name Operating system Controller Port Address Status Offset !NEWCON02 TRU64 UNIX THIS 2 000008 OL this 00 HOST_ID=2000-0000-C123-ABCD ADAPTER_ID=1000-0000-C123-ABCD UNIX01 TRU64 UNIX THIS 2 000008 Offline 00 HOST_ID=1000-0000-C123-ABCD ADAPTER_ID=1000-0000-C123-ABCD
Once discovered, you can quickly resolve this problem by deleting the old connection and renaming the new one at the storage controller (HSG80). See Chapter 4 for more information about storage configurations including selective storage presentation.
A.1.9 CAA Daemon (caad) Doesn't Start When Booting
The explanation here is that there probably isn't a TruCluster Server license registered on that member. Each member must have the TCS-UA license. See the Cluster Administration manual (Chapter 11). The boot messages will probably look like this:
TruCluster Software is not licensed for use on this system. This system will continue running but Cluster Application Availability will not function. Please install the TCS-UA license and reboot this member.Error: CAA daemon not started. CAA dependent system services will not start. NFS mount daemon started NFS export service started Cannot communicate with the CAA daemon. ... 14-Sep-2002 18:01:37 [600] esmd: System Error: The CAA daemon has failed and cannot be restarted
And you may also see messages in the /var/adm/messages file:
Sep 14 18:07:30 kyle vmunix: This cluster member is missing the TCS-UA license PAK.
A.1.10 CFS Boot Error When Mounting cluster_root
The first booting member gets CFS errors when trying to mount cluster_root. You may see an error message similar to:
WARNING: Magic number on ADVFS portion of CNX partition on quorum disk is not valid
This could be a problem with the quorum disk itself or a path to the quorum disk. See the Cluster Administration manual (Chapter 11).
A.1.11 CFS Boot Error When Mounting Boot Partition
When booting a member into an existing cluster, you may see an error:
cfs_mountroot: CFS server already exists for node boot partition
This usually is an indication that the boot_parition is currently mounted by another cluster member. Unmount the boot_partition.
A.1.12 Can't umount a File System that No Longer is Served by a Cluster Member
Use "cfsmgr–e" to see if the file system is being serviced. If it is "Not Served", you can use the "cfsmgr–u" command to forcibly unmount the domain. See Chapter 11 of the TruCluster Server Cluster Administration manual for details.
A.1.13 AutoFS File Systems Become Busy or Unresponsive
Forcibly unmount the AutoFS intercept points and autofs file systems served by the member. See Chapter 7 of the TruCluster Server Cluster Administration manual for details.
A.1.14 Anything Else "Unexpected" and Not Covered Specifically
Check the console, kern.log, and daemon.log in /var/adm/syslog.dated; messages in /var/adm; Compaq Analyze (ca); and evmget (and associated filters). Admittedly this is a wide net, but as you find problems or curious results in the above, you can narrow your approach. For example, if you find AdvFS I/O errors in the messages file, you might begin looking for storage errors with ca to diagnose a possible storage or controller problem.
EAN: 2147483647
Pages: 273