Research Method
|
| < Day Day Up > |
|
The research was conducted in two phases using a linked “sequential mixed methods” approach, with the first phase based on the “interpretivist” paradigm (qualitative approach) that was linked to the second phase based on the “positivist” paradigm (quantitative approach) (Tashakkori & Teddlie, 1998). The first phase involved a literature review, informal in-depth interviews with experts internationally, and a case study of an Australian food processor centered netchain. A theoretical framework (Figure 2) was developed in the first phase using a grounded research method, with literature used to support the description of what was observed in the case study. [For a more detailed description, see Storer (2001).] In the model, it was suggested that expected future outcomes from the relationship were related to the nature of the inter-organizational information feedback system adopted in the chain, which, in turn, was related to current perceived outcomes of the chain (as suggested by Benedict & Margeridis, 1999; Bowersox & Closs, 1996; Stank, Emmelhainz, & Daugherty, 1996; Vijayasarathy & Robey, 1997). Further, the model argued that the results would be moderated by factors such as product and market uncertainty, relationship dependency and power, experience in the relationship and in the industry, as well as personal characteristics (as suggested by Ancona & Caldwell, 1992; Bensaou, 1999; Spekman, Kamauff, & Myhr, 1998).
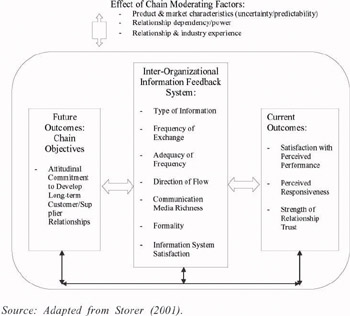
Figure 2: Theoretical framework – Inter-organizational information feedback system in a chain context Source: Adapted from Storer (2001).
The aim of the second phase was to evaluate, test, and refine the theoretical framework based on a survey of food processors and a further perishable product chain case study. Support for the second phase of the research was received from a large Australian retail chain that provided introductions to four of their significant suppliers for each major food product category. All suppliers were significant to the retail chain in terms of volume, value, or strategic significance. A total of 45 food categories were covered and included dry, fresh, chilled, and frozen food products based on meat, dairy, fruit, vegetable, and cereals in the form of ingredients as well as snacks, meals, and drinks. Food processors varied from large multinational and national organizations to smaller regional suppliers.
Data Collection
In-depth interviews of 111 Australian food processor purchasing managers (30%), sales/marketing mangers (47%), and general managers/owners (23%) were conducted during April to December 2002. Where possible, interviews were conducted face to face, with phone interviews and self-completion used as a last resort. Relationships with 176 suppliers and 297 customers were discussed in the interviews. Interviewees were asked to discuss two suppliers or two customers that were significant in terms of volume, value, or strategic intent. Some interviewees answered questions for several different product categories, e.g., milk, cheese, and small goods.
A structured questionnaire (Appendix 1) was developed based on the framework developed in the food processor netchain case study (Storer, 2001). The aim was to get a description of the IOIS used to manage relationships with customers and suppliers. Of interest were the formal systems, such as biannual product and pricing reviews, as well as informal ad hoc systems used occasionally to resolve problems or discuss an opportunity.
To operationalize the model, the inter-organizational information system (IOIS) was examined by asking participants about the types of information exchanged to manage the relationship (Mohr & Nevin, 1990). Specifically, participants were asked whether they exchanged information for problem resolution, new product development, forecast supply and demand, and opportunities and threats (Anderson, Lodish, & Weitz, 1987; Andraski, 1998; Bowersox & Closs, 1996; Christopher, 1997; Cunningham & Tynan, 1993; Hines, Rich, & Hittmeyer, 1998; Van Hoek, 1998; Womack, Jones, & Roos, 1990). Based on the netchain case study, performance feedback was expanded to cover product quality, on-time delivery, completeness of orders, flexibility to change orders, invoicing accuracy, profitability, costs, and prices.
For each type of information shared, details were sought of: communication media used; formality of the process; the frequency it was shared on average in a year (absolute frequency); frequency adequacy, i.e., was information exchanged as often as necessary (relative frequency); and the direction the information flowed (upstream, downstream or both directions) (Anderson, Lodish, & Weitz, 1987; Bensaou & Venkatraman, 1995; Borgen & Ohren, 1999; Choo, 1996; Daft & Lengel, 1986; Daft & Lengel, 1996; Dansereau & Markham, 1987; Ellinger, Daugherty, & Plair, 1999; Farace, Monge, & Russell, 1977; Huber & Daft, 1987; Mohr & Nevin, 1990). Perceived satisfaction with the information system was measured in terms of accuracy, reliability, and completeness; usefulness and relevancy; depth and range of content; and being timely and up to date (O’Brien, 1999).
Expected future outcomes from the relationship were measured as attitudinal commitment to develop long-term customer–supplier relationships (Ganesan, 1994; Gundlach, Achrol, & Mentzer, 1995; Sharma, Young, & Wilkinson, 2001).
Current outcomes from the relationship were measured by comparing perceptions of the buyer/seller’s performance, responsiveness and willingness to change, and trustworthiness compared to others in the industry (Anderson, Lodish, & Weitz, 1987; Anderson, H kansson, & Johanson, 1994; Bensaou & Venkatraman, 1995; Doney & Cannon, 1997; Ganesan, 1994; Gassenheimer & Scandura, 1993; Gundlach, Achrol, & Mentzer, 1995; Kohli, Jaworski, & Kumar, 1993; Kumar, Stern, & Achrol, 1992; Womack, Jones, & Roos, 1990).
Moderating variables included uncertainty, dependency/power, and experience. Uncertainty was measured as predictability of demand, production yield, and quality and quantity of supply; market competition; and changing consumer preferences (Ganesan, 1994; Kumar, Stern, & Achrol, 1992). The relationships dependency and power were measured as follows: availability of alternative customers and suppliers; importance to each other; influence; and ease of replacement (Ganesan, 1994; Kumar, Stern, & Achrol, 1992). Experience was measured in terms of the number of years working in the industry and with the organization (Doney & Cannon, 1997; Ganesan, 1994) as well as how well the industry and the other organization’s business were understood.
To explore the dynamics of the interaction over time, the information satisfaction and relationship outcome variables were measured in terms of the current situation and how it had changed over the last 5 years. Comments were recorded about respondents’ perceptions about the reasons for change. As a result of explanations about reasons for change, two additional questions were added about perceptions of customers/suppliers initiating new ideas to improve the category/business or to improve the organization’s knowledge of the industry.
Data Analysis
A within respondent comparison was made between the pairs of third-party organizations, discussed by each respondent to determine if they were perceived to be significantly different. However, some respondents provided answers about a customer or supplier for more than one food product category (maximum five). Therefore, the following question arose: Were answers given generically about the customer/supplier organization as a whole, or did answers depend on which food category was being discussed? The first test was to determine whether each respondent was able to give different views across multiple product categories for one organization (“within respondent comparison of one organization”). Euclidean distances were calculated across the metric scale questions so that each respondent could get a measure of the similarity of the responses given for organizations dealing with different food product categories. A low or zero Euclidean distance meant that all the responses were similar (Hair et al., 1998). A high Euclidean distance meant that responses were different (Hair et al., 1998). As the Euclidean distance was calculated based on all questions simultaneously, no comparison could be made between categories of variables or constructs. Euclidean distances were calculated for each pair of food categories. For example, if the third party dealt with milk, cheese, and ice cream, then Euclidean distances were calculated between responses about milk and cheese, milk and ice cream, and cheese and ice cream. The average Euclidean distance score for each respondent was calculated where three or more food product categories were discussed for a customer or supplier organization (“average Euclidean distance for one organization”’). One-sample t-tests were run on average Euclidean distances for one organization. The null hypothesis was that respondents’ average Euclidean distance for one organization was equal to zero, i.e., responses were the same for a third-party organization no matter what product category was discussed. If the null hypothesis was accepted, each respondent’s answers about different food categories would be essentially the same. Therefore, these responses could be averaged together and treated as one case or unit of analysis in subsequent analysis.
The next test was to determine if respondents provided different answers about each pair of third-party organization (“within respondent comparison of organizational pairs”). Each respondent’s average Euclidean distance score for one organization was averaged for all organizations discussed to give an “average Euclidean distance of organizational pairs.” A one-sample t-test was run on respondent average Euclidean distances of organizational pairs. The null hypothesis was that respondents’ average Euclidean distances of organizational pairs were equal to zero, i.e., responses were the same for every pair of third- party organizations.
The final series of tests were to determine if supplier-oriented boundary spanning staff (purchasing staff) had significantly different responses to customeroriented boundary spanning staff (sales staff). For each focal firm where data was collected about both customers and suppliers, a “within organizational comparison” was made of pairs of respondents. Initially bivariate analyses were conducted. The t-tests were run for metric scale variables, and chi-square tests were run for nominal and ordinal scale variables (Hair et al., 1998). When significant differences resulted across multiple variables, a discriminant analysis was run to determine which variables better explained the differences, as the dependent variable (customer or supplier) was nominally scaled (Klecka, 1980).
|
| < Day Day Up > |
|
EAN: 2147483647
Pages: 148