| There is a joke that goes something like this: A drunk is seen falling about on the roadside beside a lamp post, looking for something. A passerby asks him: "What are you looking for?" "My car keys," replies the drunk. "Well," says the passerby, "do you know approximately where you lost them?" "Somewhere over there," says the drunk pointing to the dark side of the road. "So why look for them here?" "Because there is light here," replies the drunk! The problem with many proprietary operating systems is that you are compelled to expend your energies looking for performance problem solutions, but only in areas where the available tools permit you to do so. Here the zSeries and S/390 are different from other platforms. The S/390 platform has been designed and tuned for more than two decades and there exists a vast array of tools, both from IBM and other vendors, that can be used to find bottlenecks and tune them out. Additionally, with Linux, you have the option to tweak the source code. 26.3.1 Lockmeter When you have a shared-memory multiprocessor operation, you require a locking mechanism before you access a shared resource, such as shared data structure, and a release mechanism when you are done. Contention occurs if more than one process tries to acquire the lock at the same time. Since only one process can have the lock, the other process has to wait until the lock is released. This wait can be implemented in one of two ways: A tight instruction loop that constantly attempts to acquire the lock until it succeeds. This is referred to as "spinning." The task requiring the lock is suspended and the processor runs some other task.
Locks are therefore classified as either "spin" locks or "suspend" locks. Symmetric multiprocessor (SMP) system performance is typically determined by two factors: Instruction path length Lock contention
Lockmeter is an Open Source tool from SGI to monitor the spin lock and read/write lock usage. It reports statistics for all spin locks, summary for each spin lock, and data for each caller of the lock. You can use the data from lockmeter to identify which portions of the kernel code are responsible for lock contention and hence a source of bottlenecks. The tool consists of a kernel patch that implements the data collection mechanisms and the user level command lockstat. Lockmeter is available at: http://oss.sgi.com/projects/lockmeter/ A version of a kernel patch for S/390 platform is available for both 31-bit and 64-bit platforms. For more information, see "Lockmeter: Highly-Informative Instrumentation for Spin Locks in the Linux Kernel" at: http://oss.sgi.com/projects/lockmeter/als2000/als2000lock.html 26.3.2 Profiling tools Kernel profiler kernprof kernprof is an Open Source tool from SGI. It is a kernel profiler that collects performance- related data in the Linux kernel to help you to identify performance problems. The tool offers various sampling modes which differ in the quality and quantity of the information collected (and in the overhead imposed on execution time): The simplest mode merely gathers the program counters at certain intervals. The most sophisticated mode constructs a complete call graph containing data for each function that is called and the callers while profiling was on.
The tool consists of a kernel patch and the command, kernprof, that allow a user to configure and control kernel profiling. For more information and downloads, see Kernprof (Kernel Profiling) at: http://oss.sgi.com/projects/kernprof/ Application profiling You do profiling if you are trying to understand the performance characteristics of an application such as heavily used areas of an application source code. The goal is to determine problems with a view to making code changes to fix the problem. Three application profilers currently available on Linux on the mainframe are listed in Table 26-1. Table 26-1. Tools for application profilingTool name | Where available | Description |
|---|
gprof | Part of the binutils component of Linux for S/390. | gprof is the GNU profiler for single-threaded C programs that is available on Linux for S/390. You can run gprof repeatedly to collect data, then average the results of each run to obtain more accurate statistics. | cprof | Part of the binutils component of Linux for S/390. | cprof is the GNU profiler for multithreaded C and C++ programs that is available on Linux for S/390. | vprof | http://aros.ca.sandia.gov/~cljanss/perf/vprof/ | vprof is a visual profiler you can use for single-threaded C and C++ programs. It is available with SuSE Linux Enterprise Server offering. |
26.3.3 Monitoring tools Display processes the top command In Linux, any running program is assigned a process ID. The system administrator can list these IDs with the top command. The administrator can use the IDs to stop, restart, or change the priority of a process. The top command gives a relatively complete list of the processes running on the system (Figure 26-1 and Figure 26-2). Especially useful with the wchan option (to enable: "f," "u" and "enter"). Figure 26-1. TOP output 
Figure 26-2. Display of CPU top processes 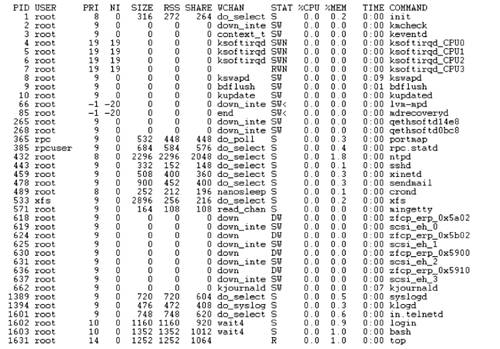
Notes: top does not show any LAN activity. Resident set size (RSS) is often incorrect because it simply adds the resident size of the process without taking shared memory into consideration.
Display system status the sysstat package SYSSTAT is an Open Source statistics gathering package comprising the listed commands: mpstat The mpstat command reports processor statistics for each available processor, starting with processor 0. The command can be used for SMP or UP machines. It reports global average activities among all processors. For UP machines, only global average activities are printed. For more information, see the SYSSTAT utilities home page at: http://perso.wanadoo.fr/sebastien.godard/. vmstat (report virtual memory statistics): vmstat produces a report that contains information about processes, memory, paging, block I/O, traps, and CPU activity. A sample output is shown in Figure 26-3. See VMSTAT: Report virtual memory statistics at: http://nodevice.com/sections/ManIndex/man1908.html for further information. Figure 26-3. Sample output of vmstat command 
iostat (report CPU statistics and input/output statistics for tty devices and disks): You can use the iostat command to monitor disk loading. It calculates this by measuring the time the disks are busy in relation to their average transfer rates. You can use reports generated by iostat to change system configuration to balance I/O load between physical disks. For more information, see SYSSTAT utilities home page at: http://perso.wanadoo.fr/sebastien.godard/. sar (system activity information): The sar command displays selected activity counters in the operating system. The data can be saved in a file you specify as well as being displayed on screen if you specify the o filename flag. If you omit the filename, /var/log/sa/sadd file is used. The dd parameter indicates the current day. sar is used to look at the historical view of system performance. sar does not show LAN activity or paging, etc. For more information, see SYSSTAT utilities home page at: http://perso.wanadoo.fr/sebastien.godard/. Other sar related tools are: sadc (system activity data collector): This command reports only local activity and is to be used as a back-end to the sar command. The command samples system data a specified number of times at specified intervals in seconds. The data are written to screen or to a file. If no outfile is specified, sadc saves to /var/log/sa/sadd file, where the dd parameter indicates the current day. sa1 (collect and store binary data in the system activity daily data file): The sa1 command can be started by the cron command. It is a shell procedure variant of the sadc command; therefore, it handles all of the flags and parameters of that command. The command collects and stores binary data in the /var/log/sa/sadd file, where the dd parameter indicates the current day. sa2 (write a daily report in the /var/log/sa directory): The sa2 command can be started by the cron command. It is a shell procedure variant of the sar command, so it handles all of the flags and parameters of the sar command. It writes a daily report in the /var/log/sa/sardd file, where the dd parameter indicates the current day.
RMF PM of OS/390 Linux support Resource Measurement Facility Performance Monitoring of OS/390, or RMF PM, or PM of OS/390 for short, is a workstation-based (any Windows platform or Linux) function that allows you to monitor the various resources in a z/OS, OS/390, or Linux on zSeries system. Using RMF PM, you can analyze Linux on zSeries performance data, together with z/OS performance data in one application from the same workstation. RMF PM provides filtered data in a graphical format, referred to as DataViews. This allows you to manage multiple DataViews as one entity by providing the concept of a PerfDesk, and it offers the means to make DataView and PerfDesk definitions persistent for re-use at any time. To gather data on the host system, you need to install the RMF Distributed Data Server (DDS). It is available for Linux for zSeries 64-bit, Linux for zSeries and S/390 31-bit, and for PC-based Linux. The data gatherer must be active on the Linux machine that you want to monitor. You also need client code on the workstation from which you intend to carry out the performance monitoring. The new PM of OS/390 Java Edition is now provided on a product level and runs, in contrast to its predecessor, on any Windows platform, such as Windows 9x/NT, or on Linux. Both the data gatherer and the client code can be downloaded from the RMF Web site at no charge (and without warranty) under IBM's licensing terms: http://www.ibm.com/servers/eserver/zseries/zos/rmf/rmfhtmls/pmweb/pmlin.htm Here, you can also determine the exact requirements for the workstation on which you want to run RMF PM. Highlights: Generate graphical trend reports. Store the data in spreadsheet format (*.WK1, supported by Lotus 1-2-3, StarOffice, MS Excel, and so forth). Persistently store performance analysis scenarios (Performance Desktops). Gather historical performance data. Filter the performance data. Mix OS/390 and Linux performance data in one screen. Use a graphical user client to access performance data in a flexible and well-configured format.
For Linux, the following classes of metrics are available: LINUX_SYSTEM: (for example, My Penguin in Figure 26-4) general statistics and Apache metrics. Figure 26-4. With this tool, you can create DataViews that graphically depict different resources. Reprinted with permission from International Business Machines Corporation 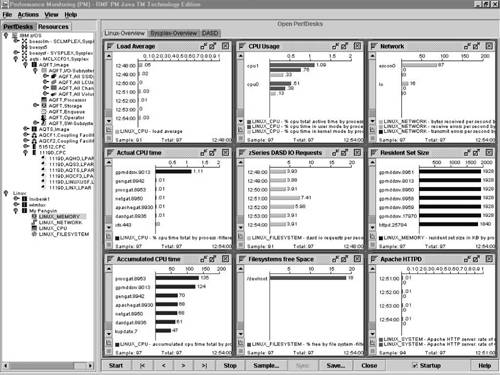
LINUX_CPU: metrics related to CPU(s). LINUX_FILESYSTEM: metrics related to file systems attached or mounted by the Linux image or DASD performance. The DASD performance metrics are available only if running Linux kernel 2.4 on an IBM zSeries or S/390 mainframe. LINUX_NETWORK: metrics related to the network devices attached to the Linux image. LINUX_MEMORY: memory statistics for the Linux image.
Data analysis: The most striking feature of RMF PM is its capability to navigate through a large number of resources or users that are using the resources, or users that are delayed by these resources, in a logical and methodical way. Commencing data analysis is simple. From the PM of OS/390 main panel, double click any metric of interest. This will bring up the PM of OS/390 Analysis in <sysplex> panel. From here, you can use the tool to very quickly and effectively locate the performance bottleneck and to act appropriately before the problem gets severe. For example, if you notice a very high activity rate in PerfDesk, you can ask RMF PM to show the jobs that are using the associated volume most frequently, that is, the jobs that are responsible for the high activity rate. Additionally, RMF PM also shows you the jobs that are most impacted because they are waiting for that volume. z/VM monitoring tools Tools that are useful for monitoring z/VM are listed in Table 26-2. Table 26-2. z/VM monitoring toolsTool name | Where available | Description |
|---|
FCON/ESA | http://www.vm.ibm.com/perf/perfprod.html | A sophisticated system console and performance monitor. FCON/ESA monitors and displays system performance on a real-time basis. It also stores and can process historical information. You can use FCON/ESA to analyze bottlenecks. The clarity of data presentation enables even casual users to use the tool with ease. Threshold monitoring is provided which allows alerts to be generated so that corrective action can be taken at an early stage. FCON/ESA can be configured to communicate with the RMF Distributed Data Server that is used with RMF PM. | VMPAF | http://www.vm.ibm.com/perf/perfprod.html | Use IBM's VMPAF to correlate and chart system performance problems and to perform trend analysis. VMPAF analyzes the relationships between performance variables. Using interactive graphics, it gives you a clear picture of these relationships. The variables analyzed can come from various sources such as VMPRF, RTM, and other data sources. | VMPRF | A priced feature that ships with the z/VM system, for more details, see: http://www.vm.ibm.com/perf/perfprod.html | VMPRF uses your system's monitor data to analyze system performance. VMPRF detects and diagnoses performance problems, analyzes system performance, then gives you printed reports and trend data showing performance and usage of your z/VM system. It produces performance reports and history files from the monitor data of your VM system. VMPRF simplifies performance analysis and resource management of z/VM. | RTM VM/ESA | A priced feature that ships with the z/VM system, for more details, see: http://www.vm.ibm.com/perf/perfprod.html | RTM VM/ESA is a real-time monitor and diagnostic tool which can be used for short-term monitoring and the installation management of z/VM environments. RTM VM/ESA gives you the current z/VM system performance. You can also use it to validate the system and to establish additional hardware or software requirements when you install extra hardware and/or software. |
|