Section 12.3. Unix Utilities
12.3. Unix UtilitiesSometimes it's helpful to use a tool outside the Samba suite to examine what's happening inside the server. Two diagnostic techniques that can be of particular help in debugging Samba troubles are to monitor the system calls made by the server daemons and to monitor the network traffic between the client and the server. 12.3.1. Tracing System CallsThe trace command masquerades under several different names, depending on the operating system. On Linux it is strace; on Solaris and AIX you'll use truss; SGI has padc and par; and HP-UX has trace or tusc. All have essentially the same function, which is to display each operating system function call as it is executed. This display allows you to follow the execution of a program, such as smbd, and often pinpoint the exact call that is causing the difficulty. A sample strace output for the Linux operating system follows. This is a small section of a larger file created during the opening of a directory on the Samba server. Each line lists a system call and includes its parameters and the return value. If there was an error, the error value (e.g., ENOENT) and its explanation are also shown. You can look up the parameter types and the errors that can occur in the appropriate trace manual page for the operating system you are using. chdir("/pcdisk/public") = 0 stat("mini/desktop.ini", 0xbffff7ec) = -1 ENOENT (No such file or directory) stat("mini", {st_mode=S_IFDIR|0755, st_size=1024, ...}) = 0 stat("mini/desktop.ini", 0xbffff7ec) = -1 ENOENT (No such file or directory) open("mini", O_RDONLY) = 5 fcntl(5, F_SETFD, FD_CLOEXEC) = 0 fstat(5, {st_mode=S_IFDIR|0755, st_size=1024, ...}) = 0 lseek(5, 0, SEEK_CUR) = 0 SYS_141(0x5, 0xbfffdbbc, 0xedc, 0xbfffdbbc, 0x80ba708) = 196 lseek(5, 0, SEEK_CUR) = 1024 SYS_141(0x5, 0xbfffdbbc, 0xedc, 0xbfffdbbc, 0x80ba708) = 0 close(5) = 0 stat("mini/desktop.ini", 0xbffff86c) = -1 ENOENT (No such file or directory) write(3, "\0\0\0#\377SMB\10\1\0\2\0\200\1\0"..., 39) = 39 SYS_142(0xff, 0xbffffc3c, 0, 0, 0xbffffc08) = 1 read(3, "\0\0\0?", 4) = 4 read(3, "\377SMBu\0\0\0\0\0\0\0\0\0\0\0\0"..., 63) = 63 time(NULL) = 896143871 This example shows several stat( ) calls failing to find the files they were expecting. You don't have to be an expert to see that the file desktop.ini is missing from that directory. However, be warned that failures reported by the trace tool are not always server errors. In this example, it might be perfectly normal that the desktop.ini file did not exist. With a little bit of detective work and deductive reasoning, many difficult problems can be identified by looking for obvious, repeatable errors with trace. Tracing is also useful when diagnosing abnormally high CPU usage in Samba. An smbd process that continually consumes the majority of available CPU cycles is sometimes a symptom of a corrupt tdb file or possibly a source level bug. In this case, it is helpful to identify what operation the process is spending its time executing. A continually repeated operation such as an fcntl( ) call is a good place to look for clues. Perhaps the file descriptor associated with the fcntl( ) call can give some clue to as to what the process is doing.[*] However, sometimes high CPU usage is caused by a very active client. So don't jump to conclusions, and don't be too quick to rule out client or application bugs.
12.3.2. Network Packet CapturesThere are a variety of programs for capturing network traffic (a.k.a. network sniffing) and saving it to a file for later analysis. Almost all Unix/Linux operating systems include some type of tool for this purpose. Solaris has the snoop utility, HP-UX has nettl, AIX has iptrace and ipreport, and Linux provides tcpdump. Like most tools on Linux, tcpdump (http://www.tcpdump.org) is available for various platforms. There's even a Windows port named WinDump (http://www.winpcap.org/windump). By far, the best freely available application for dissecting the SMB/CIFS protocol is Wireshark (http://www.wireshark.org), formerly Ethereal. This network analyzer allows you to examine very specific protocol minutia such as request flags or server support for specific protocol features, and is able to read the file formats of most free and commercial network capture applications. Wireshark packages are available for various Unix and Linux platforms as well as Windows and include a command packet capture tool. You probably could rely on it for all of your network analysis needs. To begin our network analysis discussion, we'll separate the process of capturing the packets and analyzing them. This way, you can use whatever sniffer tool is provided by the operating system vendor and still use Wireshark for analyzing the SMB/CIFS conversation. We use tcpdump in the examples, primarily because it is available on a wide variety of platforms. When capturing packets, the important points to consider are:
Most capture programs have command-line parameters that allow you to control these aspects of sniffing. The following example shows how to capture the conversation between our server (192.168.236.86) and the client used for testing (192.168.236.10). $ tcpdump -s 0 -w cifs.pcap -i eth0 \ "host 192.168.236.86 and host 192.168.236.10 and (port 139 or port 445)" The -s 0 options instructs tcpdump to save the full packet, the -w parameter is used to define the file used for storing the data, the -i option refers to the network interface used for the capture (eth0 in this instance), and the remaining string enclosed in double quotes describes the capture filter.[*] This filter restricts tcpdump to saving packets on ports 139 or 445 between the two hosts at 192.168.236.10 and 192.168.236.86. The full filter syntax is covered in the tcpdump manpage. The capture session can be terminated by typing CTRL-C.
Next, we can open the file cifs.pcap in Wireshark for further analysis. 12.3.2.1. Using WiresharkWireshark is a protocol analyzer, meaning that it can dissect a packet and label individual bits according to a network protocol specification. This dissection can help to locate points where the communication between two hosts takes an unexpected path. Wireshark can also provide some network statistics summaries, such as I/O throughput and packet retransmission. More information on using Wireshark can be found at http://www.ethereal.com and Angela Orebaugh's book Ethereal Packet Sniffing (Syngress). Figure 12-1 shows a client searching for a file that does not exist, as can be seen from the error STATUS_NO_SUCH_FILE. Just as in the case of errors reported by trace, this missing file could be a simple innocuous search caused by the client's PATH setting. Or it could be the reason for an application failing to launch. Figure 12-1. Using Wireshark to view a conversation between Samba and Windows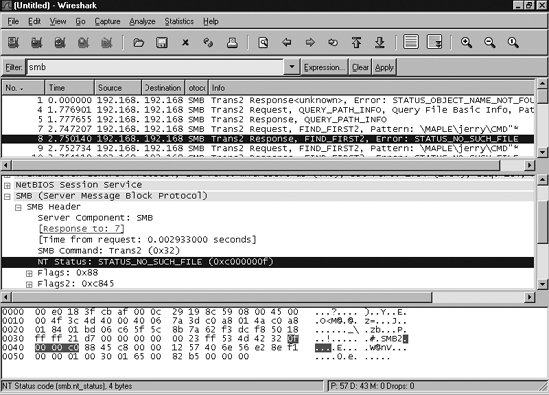 |
EAN: 2147483647
Pages: 135