Foundation and Supplemental Topics
Cisco IPS Device ManagerThe Cisco IDM is a Java-based web interface that enables you to configure and manipulate the operation of your Cisco network sensors. Each IPS appliance running on your network has its own web server that provides access to the IDM application on the sensor. The web server uses Transport Layer Security (TLS) to encrypt the traffic to and from the sensor to prevent an attacker from viewing sensitive management traffic. The web server is also hardened to minimize an attacker's ability to disrupt or compromise its operation. This chapter focuses on the following topics:
System Requirements for IDMBecause the IDS Device Manager is a web-based application, the major system requirement is a web browser. Having sufficient memory and screen resolution also promotes effective operation of IDM. The recommended memory and screen resolution are as follows:
Cisco has identified system requirements based on the following three operating systems for use with IDM:
The recommended configuration for using Windows is as follows:
The recommended configuration for using Solaris is as follows:
The recommended configuration for using Red Hat is as follows:
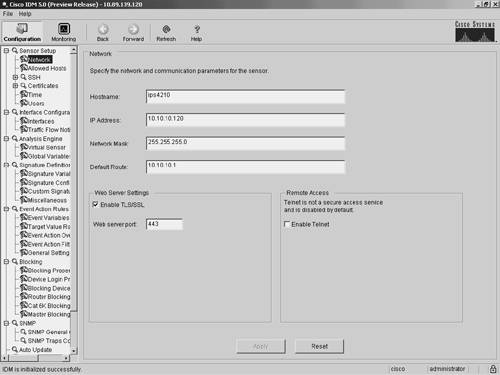
Note Although any web browser may work with IDM, Cisco supports only the browsers and system configurations mentioned here. Navigating IDMStarting with Cisco IPS version 5.0, the IDM interface has been completely restructured. The new graphical interface (see Figure 3-1) contains an icon bar with the following options:
Figure 3-1. Main IDM Screen ConfigurationConfiguring the operational characteristics of the sensor is the main functionality provided by IDM. By clicking on the Configuration icon (located on the top menu bar), you can display a list of configurable items down the left side of the screen (see Figure 3-1). These items are divided into the following operational categories:
These operational categories are explained in the following sections. Note Most operational categories have multiple options. If the individual options (for a specific category) are not shown, click on the plus sign on the left of the category name. This will expand that category and show all of the next-level options. Clicking on the minus sign (to the left of a category name) collapses the individual options under the category name. Note The configuration options displayed vary depending on the privilege level of the user who logs in to IDM. Clicking on one of the configuration options (shown on the left side of the IDM interface) displays the configuration information for that option in the main portion of the screen. For example, Figure 3-2 shows the configuration screen displayed when you select Sensor Setup>Users. Figure 3-2. Sensor Setup Users Screen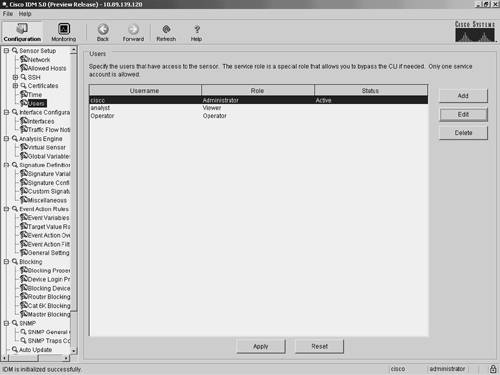 When you make changes to a configuration screen, the Apply icon is no longer grayed out. To save the changes, click on the Apply button at the bottom of the configuration screen. Clicking on the Reset button removes your changes (restoring the original configuration values). Note When you make changes to a configuration screen and then attempt to move to another configuration screen (without clicking on either the Apply icon or the Reset button), the popup window shown in Figure 3-3 appears. To save your changes, simply click on Apply Changes. To discard the changes, click on Discard Changes. Clicking on Cancel causes you to remain at the current configuration screen without applying changes or restoring them to their original values. Figure 3-3. Accept Changes Popup Window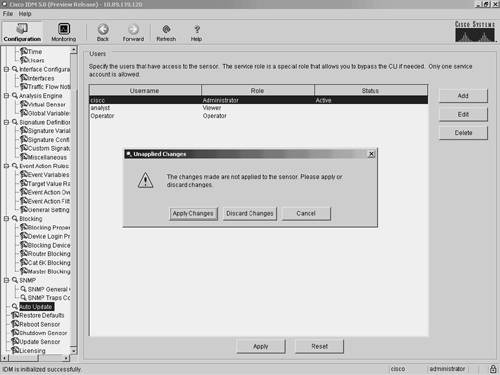 Sensor SetupWhen configuring access to your sensor, you will use the options available in the Sensor Setup category. These include configuring the sensor's IP address, the users on the system, and the sensor's time parameters. Through the Sensor Setup options, you can also configure access to the sensor for Secure Shell (SSH) and secure web access (using HTTPS). The Sensor Setup category is divided into the following options:
The Network option enables you to configure the basic sensor network properties such as IP address, default gateway, network mask, and host name. The Allowed Hosts option enables you to define which IP addresses are allowed to access the sensor via its management interface. The SSH options enable you to define the authorized host keys for systems that you want to connect to from the sensor (such as when using Secure Copy [SCP] to upgrade the sensor's software) as well as the public keys for SSH clients that are allowed to connect to the sensor. Similarly, the two Certificates options enable you to define the trusted certificates for systems that the sensor needs to connect to via HTTPS. This would commonly apply to master blocking sensors and other IPS devices to which your sensor connects by using Remote Data Exchange Protocol (RDEP). The Time option enables you to define the time settings on the sensor. This includes specifying a Network Time Protocol (NTP) server, time zone settings, and summertime parameters. Finally, the Users option enables you to view the currently configured users, add users, and change users' passwords (if you log in via a privileged account). If you log in to a nonprivileged account, you will be able to change only your own password. Interface ConfigurationEach time your sensor is powered on; it automatically detects the interface modules that are installed in the sensor. The network interfaces enable your sensor to monitor network traffic, using either promiscuous or inline modes of operation. Before monitoring traffic, the interfaces need to be configured. The command and control interface enables you to access your sensor. This interface is permanently mapped to a specific physical interface (depending on the model of the sensor). The Interface Configuration category includes the following options:
Note The selections marked with an asterisk (*) may not be shown if your sensor does not have enough interfaces to support inline mode. Inline mode requires at least two interfaces in addition to the command and control interface. The Interfaces option enables you to configure basic interface properties, such as speed and whether the interface is enabled. The Interface Pairs option enables you to define pairs of interfaces that will be used for inline monitoring. When using inline mode, you may also need to use the Bypass option to configure the software bypass mode, which determines how network traffic is handled during operational disruptions in the sensor's inspection applications. The Traffic Flow Notifications option enables you to configure the following parameters:
These parameters determine when event notifications are generated based on the flow of traffic across the sensor's interfaces. For more information on Traffic Flow Notifications, refer to Chapter 4, "Basic Sensor Configuration." Analysis EngineThe analysis engine performs packet analysis and alert detection. It monitors traffic that flows through the specified interfaces and interface pairs. The Analysis Engine category provides the following options:
To use the any of the sensor's interfaces to analyze network traffic, you must assign it to a virtual sensor. The Virtual Sensor option enables you to assign or remove sensor interfaces from a virtual sensor. Note Currently, sensor software supports only a single virtual sensor (vs0). In the future, however, Cisco IPS sensors may support multiple virtual sensors. These virtual sensors would enable you to make one physical sensor appear to be multiple sensors, each with unique configuration settings. This concept is similar to that of virtual firewalls, where a single physical firewall can be configured (via software) to operate as multiple virtual firewalls that each have unique configuration parameters. The Global Variables option enables you to configure the maximum number of IP log files that the sensor will support. Signature DefinitionNetwork intrusions are attacks and other misuses of network resources. A signature is a set of rules that a sensor uses to detect intrusive activity. As the sensor scans network traffic, it searches for matches to the signatures that it is configured to detect. When a match to a signature is found, the sensor takes the action that you have configured for that signature. The Signature Definition category has the following options:
Using the Signature Variables option, you can configure signature variables that define ranges of IP addresses. You can then use these signature variables when defining signatures. When you change the value of the variable, the change is automatically replicated to all of the signatures where it is referenced. You can also change the predefined signature variable that determines which ports are examined during web analysis. Using the Signature Configuration option, you can view the available signatures and their properties. You can enable and disable signatures as well as adding new signatures and editing the properties of existing signatures. Using the Custom Signature Wizard option, you can create custom signatures by using a menu-driven interface that simplifies the creation process. The Miscellaneous option enables you to configure specific global sensor parameters for the following aspects of the sensor's operation:
For more information on configuring these options, refer to Chapter 8, "Sensor Tuning." Event Action RulesEvent action rules define how your sensor will process specific events when it detects them on the network. Event action rules define the following functionality on the sensor:
The Event Action Rules category provides the following options:
Using the Event Variables option, you can define variables that you use when defining event filters. These variables identify lists or ranges of IP address. By defining event variables (instead of using the actual addresses in the filters), you can more easily update IP addresses. Whenever you need to add or remove an address, you just change the event variable definition. The Target Value Rating enables you to configure an asset rating for specific IP address ranges. The asset rating can be one of the following values:
The Event Action Overrides option defines when actions are automatically assigned to events based on the value of the Risk Rating. You can assign an event action override for each of the actions that you can normally assign to a signature. The Event Action Filters option enables you to define event action filters. These filters prevent (or filter) configured actions from being applied to specific events. Filters can be based on numerous factors such as IP address, signature ID, and Risk Rating. The General Settings option enables you to define general settings that apply to event action rules. These include the following parameters, as well as the ability to enable and disable the meta-event generator and summarizer:
BlockingOne of the actions that you can configure your sensor to take when a signature triggers is to block traffic from the system that initiated the intrusive traffic. The two types of blocking actions that you can configure are as follows:
When you configure a signature to block a connection, it blocks only traffic from the host that triggered the signature to the destination port, the protocol (such as TCP or UDP), and the destination IP address that triggered the signature. Therefore, the blocking decision is based on the following parameters:
A host block, on the other hand, blocks all traffic from the attacking host regardless of the destination port, protocol, or destination IP address. The Blocking category has the following configuration options:
Using the Block Properties option, you can configure the basic blocking properties along with the IP addresses that the blocking devices should never block. The Device Login Profiles option defines the credentials necessary for the sensor to access the blocking devices that you add by using the Blocking Devices option. To block network traffic, the blocking device applies an access control list (ACL) to one of its interfaces. You configure which interface the blocking ACL will be applied to on routers by using the Router Blocking Device Interfaces option. Similarly, you configure which interface the blocking ACL will be applied to on Catalyst 6000 switches by using Cat6k Blocking Device Interfaces. Note For Cisco PIX and ASA blocking devices, you do not need to configure a specific interface since each uses the device's shun command to block the traffic. The Master Blocking Sensor option enables you define which sensors will serve as master blocking sensors. A master blocking sensor initiates IP blocking for another sensor, since only one sensor can initiate IP blocking on a specific blocking device. Simple Network Management ProtocolBeginning with Cisco IPS version 5.0, sensor software supports Simple Network Management Protocol (SNMP) functionality (see RFC 1157, "Simple Network Management Protocol [SNMP]"). SNMP facilitates the exchange of management information between network devices, enabling network administrators to manage network performance as well as find and solve network problems. Using SNMP, management stations can efficiently monitor the health and status of many types of network devices, including switches, routers, and sensors. Note SNMP is a simple protocol in which the network-management system issues a request, and managed devices return responses. This interaction is implemented by using one of the following four operations:
Besides polling for SNMP responses, your can configure your sensors to generate SNMP traps. In this situation, the management station does not poll the sensor for information. Instead, when a specific event occurs, the sensor sends an unsolicited message to the management system. SNMP traps are effective in environments where it is impractical to constantly poll every device on the network. The SNMP category provides the following options:
SNMP Gets, Sets, and Traps are disabled by default. To use these features to manage your sensor, you need to enable them. Auto UpdateTo maintain the latest software images on your sensors, you can configure your sensor to automatically load service pack and signature updates from a central FTP or SCP server. Selecting Auto Update displays the configuration values that your sensor will use to automatically update software. Note Your sensor cannot automatically load service pack and signature updates from Cisco.com. You need to download them to your FTP or SCP server, from which your sensors can automatically retrieve them. Furthermore, if you need to downgrade the software (return to a previous software version) on your sensor, you can use the downgrade global configuration command via the sensor CLI. Note FTP transmits login credentials in the clear (in other words, the traffic is not encrypted). Therefore, the FTP server should be on a separate management network since it will be a prime target for attack. At minimum, the user account used to retrieve sensor software images needs to have minimal privileges on the FTP server. MonitoringBesides helping you configure your sensor, IDM also provides the ability to monitor the status and operation of the sensor. The monitoring functionality is divided into the following options (see Figure 3-4):
Figure 3-4. IDM Monitoring Functionality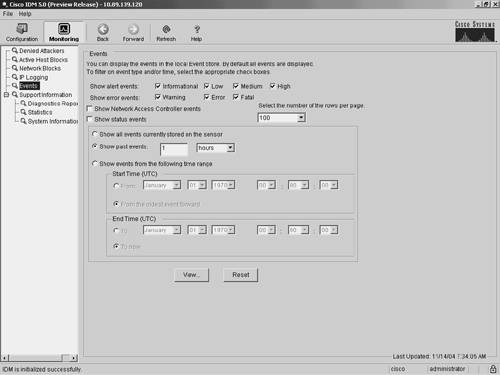 Note The monitoring options displayed vary depending on the privilege level of the user who logs in to IDM. The Denied Attackers option enables you to view the IP addresses that are currently blocked by the sensor. The Active Host Blocks option enables you to manually block specific hosts for a specified duration. Similarly, the Network Blocks option enables you to manually establish a block for an entire network. Using the IP Logging option, you can manually log traffic from a specified host. Using the Events option, you can view events generated by the sensor. Monitoring events provides a basic mechanism that you can use to examine the events that your sensor is generating. The Support Information options provide information useful in debugging the operation of the sensor. Refer to Chapter 12, "Verifying System Configuration," for more information on debugging the operation of your sensor. BackAs you move through the various configuration and monitoring screens, IDM keeps track of the options you have selected. Clicking on the Back icon enables you to return to one of previous configuration screens that you were modifying or viewing (the Back icon is similar to your browser's Back button). Each click on the Back icon takes you back one screen in the list of configuration screens that you have visited. For instance, suppose that you view the following configuration screens for the sensor:
Clicking on the Back icon returns you to the Sensor Setup Users configuration screen. Clicking on the Back icon a second time will return you to the Blocking Blocking Properties configuration screen. ForwardAs you move through the various configuration and monitoring screens, IDM keeps track of the options that you have selected. Clicking on the Forward icon enables you to move forward through this list of your selections. The functionality provided by the Forward icon is the opposite of the functionality provided by the Back icon. For instance, suppose that you view the following configuration screens for the sensor:
Clicking on the Back icon returns you to the Sensor Setup Users configuration screen. Clicking on the Forward icon returns you to the Interface Configuration>Interfaces configuration screen. RefreshClicking on the Refresh icon causes the current screen to update based on the configuration information stored on the sensor. If you try to refresh without applying changes that you have made, you will be prompted to either save the changes or discard them. HelpClicking on the Help icon brings up context-sensitive help in a separate browser window. Suppose that you are configuring the blocking properties for the sensor (via Blocking Blocking Properties). Clicking on the Help icon brings up Help information on configuring the blocking properties (see Figure 3-5). Figure 3-5. IDM Help Screen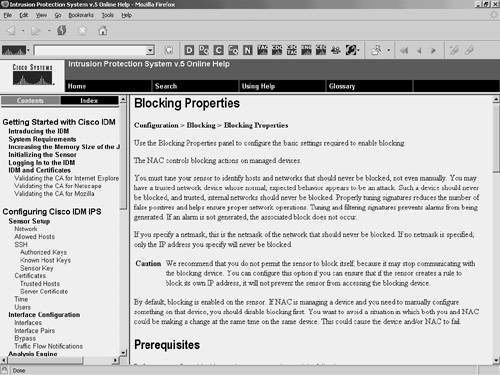 Configuring Communication Parameters Using IDMTo configure the sensor communication parameters on your sensor, perform the following steps:
|
EAN: 2147483647
Pages: 119