Office 2003 Web Components
Office 2003 Web Components
Three Office 2003 Web Components ship with Office 2003: the Spreadsheet, Chart, and PivotTable list components. You can use them on data access pages to enhance their functionality. The data access page is actually driven by a fourth Office 2003 Component called a Data Source Component. You apply this component by managing data access pages as we have discussed throughout this chapter. If a site has a license that permits intranet distribution, the site administrator can configure browsers under the license to automatically download and configure Office 2003 Web Components the first time they load a page using a component.
Office Spreadsheet Sample
Figure 14-21 shows one use of a spreadsheet component (or control) on a data access page in a browser (see dapSalesGrowth.htm in this book's companion content). Controls on the page show the CategoryName , ProductName , and ProductSales fields for the Sales By Category query in the sample database. The query is excerpted from the Northwind database sample. This query computes sales by product in 1997 for each product. The query lists the category ID and name of each product along with its sales.
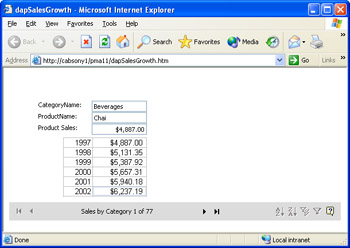
Figure 14.21: The spreadsheet component on this data access page uses sales from the database for 1997 to project sales through 2002 in a browser.
The sample in Figure 14-21 extends the basic query by projecting sales from 1997 through 2002. First, an event procedure copies the current value of the ProductSales control from the page to a spreadsheet cell . Then formulas in the component apply a progressive series of growth rates to sales starting with 1998. These rates increase sales from one year to the next. While the growth rates are the same for all products, the actual sales levels vary between products because the 1997 sales are different for each product. Finally, to protect the formulas in the current session from damage, you can lock selected spreadsheets to block users from inadvertently changing them. This is a minor issue since the correct values reappear on the next load of the page. (Clicking Refresh on the browser does not restore the original values.)
You can add a spreadsheet component to the data access page based on the Sales by Category query in the same way that you add any other control from the Toolbox. Access sequentially numbers controls of each type as it adds them to a page. Therefore, the first spreadsheet added in a session has the name spreadsheet0. You can override this setting by opening a spreadsheet component's Properties dialog box and making an assignment to the Id property for the component.
In addition to a Properties dialog box, Office Web Components have a Commands And Options dialog box. You can cause the dialog box to appear by right-clicking the spreadsheet in Design view and selecting Commands And Options from the menu. This dialog box lets you set and examine specialized properties for a component. For example, you can choose to remove the row and column headers to make the spreadsheet component's appearance integrate more tightly with the rest of the page. The sample in Figure 14-21 made these and other adjustments to the spreadsheet through its Commands And Options dialog box.
The following script shows the event procedure that transfers the current value of the contents in the productsales text box to the spreadsheet ”in particular, cell B1. The code is for the onrowenter event of the document . The document is an object that denotes the page, and the onrowenter event fires when new values are available on the object. This is similar to the current event for Access forms because it signals that new data is ready for an object. This event fires when a user first loads a page or moves between the records behind form controls. Each time the event fires, the procedure copies the current value of the productsales text box to the cell in row 1 and column 2 of the Sheet1 worksheet. By default, a spreadsheet component initially has three worksheets. You can add extra ones and add and remove the tab control for showing the active worksheet within a spreadsheet component.
<SCRIPTevent=onrowenterfor=documentlanguage=vbscript> <!-- spreadsheet0.Worksheets("Sheet1").cells(1,2)=productsales.value --> </SCRIPT> Figure 14-22 shows the Design view of the data access page in Figure 1421. In the current figure, cell B2 is selected on Sheet1. This is one row below the row populated by the preceding event procedure. In addition, the Commands And Options dialog box for the spreadsheet component appears. The Formula tab on this dialog box displays any formula for the currently selected cell. In this instance, the formula computes the value in cell B2 so that it is 5 percent greater than the value in cell B1. Cells B3 through B6 contain formulas that yield progressively larger values than those from the preceding years. As you can see from the values in column A, these rows represent successive years .
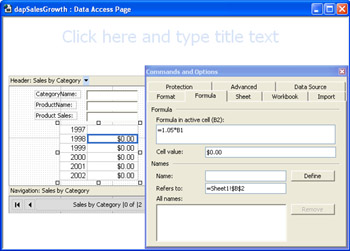
Figure 14.22: The Design view of the data access page from Figure 14-21 with the Commands And Options dialog box for its spreadsheet component.
Office Chart Sample
The sample in this section builds on the preceding one by adding an Office 2003 Chart component that charts the values in the spreadsheet. The chart shows a graphical depiction of how sales grow over time for each product. Figure 14-23 shows a product with its spreadsheet projections in a browser window. In addition, a graphical depiction of the projections appears on the right side of the page. The 3-D line chart dynamically updates each time the values in the spreadsheet change. Recall that these values change whenever the user navigates to a new product. The companion content for this chapter makes this data access page available as dapSalesGrowthChart.htm.

Figure 14.23: The Office 2003 Chart component on a data access page accepts values from a Spreadsheet component that changes its sales projections when a user moves off the current record.
To add a Chart component to your data access pages, select it from the Toolbox and then drag it to the area on your page where you want the chart. Click inside the Microsoft Office Web Component placeholder to launch the Commands and Options Builder. This builder lets you specify a data source for the chart and designate ranges in the data source for the chart to display. Figure 14-24 depicts a data access page after the addition of a chart and the selection of Spreadsheet0 as the data source for the chart. As you can see from the Data Source tab, the next step is to designate the specific ranges for the chart. In the chart shown in Figure 14-23, this includes a Category Labels range that runs along the horizontal axis and a Values range that plots against the vertical axis.
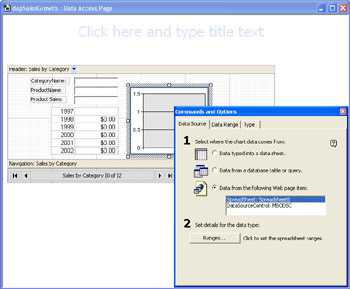
Figure 14.24: The initial Commands And Options dialog box for specifying the data source for a Chart component.
The Data Range tab opens after you click the Ranges button on the Data Source tab. Click the Add button on the Data Range tab. This creates a new data series for the chart. In this example, the builder types Series1 as the Series name. Specify the Category Labels range with this string: "Sheet1!$A$1:$A$6" . The cell values in the Category Labels range appear along the horizontal axis of your chart. Next, designate the Values range with "Sheet1!$B$1:$B$6" . The cells in the Values range plot against the chart's vertical axis. Finish specifying the chart by selecting the Type tab. Click Line to display the different types of line charts from which you can choose. Then highlight the 3D Line option. Since this completes the specification, close the builder dialog box.
After making these selections for your chart, the line will appear flat. This is because you are in Design view. Therefore, there are no values to plot. Switch into Page view to see your chart with data. Notice how the values in the 3-D line chart change when you move to a new record. This happens because the spreadsheet values revise and the spreadsheet is, in turn , dependent on the productsales text box.
Creating and Using Office PivotTable Lists
The PivotTable list control lets users sort , group , filter, outline, and report data. It can also work with data from more providers than a normal data access page or other Office XP Web Components can. For example, you can apply a PivotTable list control to Jet and SQL Server databases. You can also apply it to any ODBC data source, multidimensional data cubes, and nontraditional data sources, such as Outlook Search results. A particularly powerful feature of the PivotTable list control is that when you base a Chart control on a PivotTable list control, the chart behaves like a PivotChart. This enables filtering and analytical capabilities, including summing, adding, and averaging numeric quantities . Developers can set up a PivotTable list and let users work within the confines of a data environment without forcing them to know a data structure and a query language to extract results.
You add a PivotTable list control to a data access page from the Toolbox. By default, the control connects to the data source for the page on which it resides. You can override this default connection by right-clicking the control and choosing Commands And Options. On the Data Source tab of the Commands And Options dialog box, click Edit. In the Select Data Source dialog box, double-click Connect To New Data Source, highlight Other/Advanced for the kind of data source to which you want to connect, and click Next. This presents the Provider tab of a Data Link Properties dialog box with the full list of OLE DB providers to which you can connect your PivotTable list control. Since one of these is the OLE DB Provider For ODBC Drivers, the list of data source types to which you can connect includes any source with an ODBC driver. Complete the other tabs to specify your connection to a data source besides the one for the data access page.
You can build a PivotTable list control with the same general techniques that you use within Access forms. (See Chapter 7.) Figure 14-25 shows a PivotTable list control under construction within a data access page. The PivotTable list control already has a CategoryName field in the drop row area, and the ProductName field is about to be dropped within the CategoryName field. By subsequently dragging the ProductSales field to the detail drop area, the resulting pivot table will display total sales by product within the category.
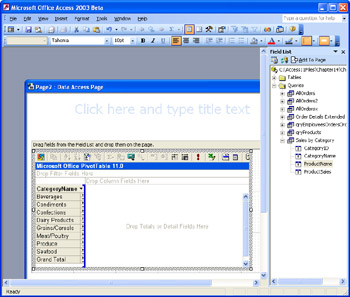
Figure 14.25: You can populate PivotTable list controls on data access pages as you would within normal Access applications.
Users can browse data access pages with PivotTable list controls and perform any desired analysis that you enable. For example, Figure 14-26 shows two different analyses in a browser window for the same basic PivotTable list control with the CategoryName , ProductName , and ProductSales fields on a data access page. The top browser window shows ProductSales aggregated by CategoryName . The bottom browser window presents a list of ProductSales by ProductName filtered by the Meat/Poultry category. Both PivotTable displays rely on the Sales by Category query that serves as the source for the PivotTable list control behind both browser windows .
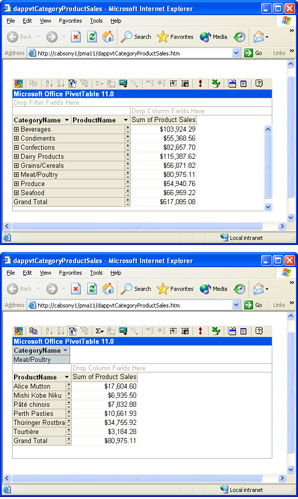
Figure 14.26: A pair of different browser windows illustrates some of the variety that users can generate from the same PivotTable list control.
Pivot tables are typically used by financial, operational, and decision-support analysts. An Access developer's job often involves setting up the data source for the PivotTable list control, such as the Sales by Category query for the two displays in Figure 14-26, and assign it to a PivotTable list control as described earlier. You can also set up a starter report in a PivotTable list control to introduce users to the resources that it exposes. You can create a starter report from a page's Design view with simple graphical techniques (a programmatic approach is demonstrated in the next section). Click the Help button for a review of how these techniques work. The power of a report based on a pivot table is that a user can easily modify the report without help from a developer. By putting the PivotTable list control on a Web page, you increase its availability to prospective users so that they can create their own report variations even when they are unable to physically connect to a LAN.
You can add a Chart control to a data access page and designate a PivotTable list control as its source. This process is easy for developers and flexible for users who are comfortable with analysis using pivot tables and pivot charts. Pivot charts are easier to design than charts on a spreadsheet, because you don't have to type in spreadsheet cell ranges as you do when basing a Chart component on a Spreadsheet component. You simply designate the PivotTable list control as a source and then graphically lay out any fields in the chart. It hardly matters what fields you put where because the point of a pivot chart is that users can modify these fields.
Figure 14-27 shows a pivot chart on the same Web page as the PivotTable list from the preceding sample. Notice there is a filter for products in the Meat/Poultry category. When you add an item to the detail drop area in a pivot chart, the control automatically aggregates it. You cannot plot an unaggregated field with a pivot chart. The control does not allow it. Notice also that the PivotTable list and PivotChart controls are in sync. When Access created the aggregate to plot product sales, it also updated the PivotTable list and added total and grand total values.
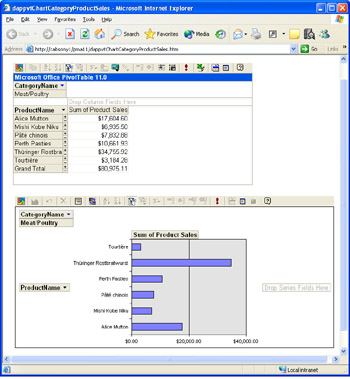
Figure 14.27: A pivot chart tied to a PivotTable list control.
Programming a PivotTable List Control from FrontPage
The Spreadsheet, Chart, and PivotTable Office Web Components do not require a data access page to function. Using FrontPage, you can insert any of these three Office Web Components on an ordinary Web page. Using the Microsoft Script Editor, you can program the operation of any Office Web Component. An advantage of this approach is that you can run these Web pages with Internet Explorer 4 while data access pages require a minimum of Internet Explorer 5. In addition, programming the object models for the Office Web Components lowers security barriers to the operation of a Web page, as compared to using the manual design interface for the Office Web Components. You can learn more about the object models for the Office Web Components from selected Help files (.chm) in the local resources folder of the following path \Program Files\Common Files\Microsoft Shared\Web Components\11\. For computers with an English-language Office 2003 installation, the local resources folder is 1033.
The sample for this section demonstrates how to automatically populate a PivotTable list control on a Web page. In addition, the sample performs an aggregation and hides the details used to compute the aggregations. Figure 14-28 displays the PivotTable list control along with its Field List on a page in a browser. The page reports the number of customers in each country from the Customers table in the Northwind.mdb file. Because the data source for the control is the Customers table, a user can respecify from a browser the participation of any field in a row, column, or filter drop area. Attempting to open this page on a Windows XP computer with the default security settings will raise a security fault that blocks the display of the page if you designed the page with the manual design techniques described in the "Creating and Using Office PivotTable Lists" section of this chapter. However, programming the solution as demonstrated here allows the page to show with the default Windows XP security settings.
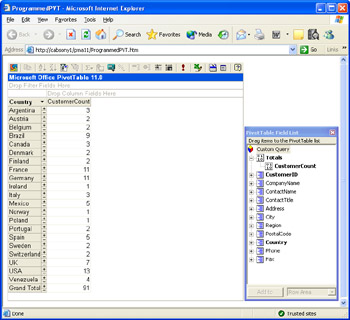
Figure 14.28: A programmed PivotTable list control with its Field List open.
The first step using FrontPage to design a page like the one in Figure 14-28 is to add a new Web page with a PivotTable list control to a Web site. You can begin by choosing File, New to open the Task Pane. Click the Blank Page link in the New Page section of the New Task Pane to open an empty page. From the tab controls below the page, select the Design tab. Then choose Insert, Web Component to open the Insert Web Component dialog box. Select the Spreadsheets And Charts item in the Components Type list on the left side of the dialog box. Double-click the Office PivotTable item from the Choose A Control list on the right to add the control to the page. The double-click also closes the dialog box. At this point, your page is likely to have a name such as new_page_1.htm, and the page's title is new_page_1. Choose File, Save As to create a more meaningful filename and title for the page. Enter a name, such as ProgrammedPVT, in the File Name box on the Save As dialog box. This revises the page's filename to ProgrammedPVT.htm and its title to ProgrammedPVT. The default name for the PivotTable list control in the code behind the page is PivotTable1.
Now that you have a PivotTable list control on a blank page, you are ready to program it. Choose Tools, Macro, Microsoft Script Editor to open the IDE behind the Web page. If the Document Outline window does not show, choose View, Other Windows, Document Outline. From the Script Outline view of the Document Outline window, double-click the onload event for the window object. This opens a script block in the head section of the code for the Web page with the shell for an onload event procedure that fires as soon as the page loads. The complete script follows . The script's role is to connect the PivotTable list control to the Customers table in the Northwind database and to format the page so that it looks like the display in Figure 14-28.
The onload event procedure has five short blocks of code. No additional custom code is necessary to prepare the Web page with its PivotTable list control for display.
-
The first block specifies an ADO connection string for the Northwind.mdb file and assigns the string to the ConnectionString property for the PivotTable1 object. Recall that the PivotTable1 object represents the PivotTable list control on the page.
-
The second code block instantiates and opens an ADODB Recordset object that points at the Customers table in the Northwind.mdb file. This block also assigns the recordset to the DataSource property of the PivotTable1 object.
-
The third block assigns the Country field to the row drop area and the CustomerID field data drop areas within the PivotTable list control. The ptView object represents the active view of the PivotTable list control. The InsertFieldset method for the view object of a PivotTable object enables the assignment of fields to drop areas within the PivotTable list control.
-
The event procedure's fourth section designates a variable ( CustomerIDCnt ) for an aggregate function that counts the number of CustomerID values within each country. Then the code assigns the variable to the data drop area.
-
The closing code section invokes the HideDetails method for the ActiveData object within PivotTable1. This hides the CustomerID values when the Web page opens. The count of CustomerID values remains visible.
Subwindow_onload DimstrConn Dimrst1 DimstrSource DimptView 'AssignconnectionstringtoPivotTable1 strConn="Provider=Microsoft.Jet.OLEDB.4.0;"&_ "DataSource=C:\ProgramFiles\Microsoft"&_ "Office\Office11\Samples\Northwind.mdb" PivotTable1.ConnectionString=strConn 'AssignrecordsettoPivotTable1 setrst1=CreateObject("ADODB.Recordset") strSource="SELECT*FROMCustomers" rst1.OpenstrSource,strConn PivotTable1.DataSource=rst1 'AssignRowandDatadropareas setptView=PivotTable1.ActiveView ptView.RowAxis.InsertFieldsetptView.Fieldsets("Country") ptView.DataAxis.InsertFieldsetptView.Fieldsets("CustomerID") 'DevelopCustomerIDcountandassigntoDatadroparea setptConstants=pivotTable1.Constants setCustomerIDCnt=ptView.AddTotal("CustomerCount",_ ptView.Fieldsets("CustomerID").Fields(0),_ ptConstants.plFunctionCount) ptView.DataAxis.InsertTotalCustomerIDCnt 'HidedetailstoshowjustCustomerIDcount PivotTable1.ActiveData.HideDetails EndSub EAN: 2147483647
Pages: 144
- Measuring and Managing E-Business Initiatives Through the Balanced Scorecard
- A View on Knowledge Management: Utilizing a Balanced Scorecard Methodology for Analyzing Knowledge Metrics
- Technical Issues Related to IT Governance Tactics: Product Metrics, Measurements and Process Control
- Managing IT Functions
- Governing Information Technology Through COBIT