Creating Interactive Reports with Computed Fields
Creating Interactive Reports with Computed Fields
Data access pages support another use for controls: using interactive reports. An interactive report lets you represent a parent-child relationship. Interactive reports have a section-based architecture that resembles the sections in Access reports. These Web-based reports are considered interactive because they feature controls that let users expand a parent record and see the child records associated with it. In Design view, you can promote a field so that it becomes a parent. This capability is particularly appropriate for foreign key fields that repeat across many rows in a record source. The parent fields group the repetitions as child records. Just as with forms on data access pages, you can base interactive reports on multiple record sources. The first version of data access pages in Access 2000 didn't let you edit values in interactive reports. However, the Access 2003 version supports the editing of field values within a report.
This section gives step-by-step instructions on building two-level reports and three-level reports. You will also learn techniques for improving the appearance of data access pages by using calculated fields. The section closes with a code sample for an event procedure that illustrates how to implement conditional formatting for the data values on a data access page.
Building a Two-Level Report
You populate a data access page with controls the same way whether you're building an interactive report or a form. When adding fields to an interactive report, it's important to have one field serve as a parent for the other fields on the report. For example, most of the fields in the Products table relate to individual products; however, the CategoryID field in the Products table is a parent field that can have one or more products below it.
When you build multilevel reports, you can add all fields to a report at the same level. With this approach, all fields are siblings to one another. Then you promote at least one field above the others. In the case of the Products table, promoting CategoryID will lead to a grouping of product records with the same CategoryID field value. If users interactively expand a CategoryID value, they will see the products with that CategoryID value.
You can start to build a two-level report with fields from the Products table by adding CategoryID , ProductName , UnitsInStock , and ReorderLevel to a blank data access page. This creates a form on a page similar to several of the preceding examples in this chapter ”namely, it contains what looks like a form with text boxes for the fields. Next , select the CategoryID text box and choose Promote on the Page Design toolbar. This creates a new section on the page with the banner Header: Products-CategoryID. Clicking Promote also moves the CategoryID text box into the new section and revises the Id property of the text box from Category to GroupOfCategoryID . The label for the text box also changes to Group Of CategoryID. The new label aptly describes the section, since it groups products with the same category ID value.
Figure 14-13 shows a Page view for the data access page (dapExpandCategoryIDForProducts.htm) after some rearrangement of the fields to make the report layout more compact. The CategoryID groups for 1 “5 and 7 “8 are collapsed so that you cannot see the detail records below them. However, the detail records for products with a category ID value of 6 show on the report. This is because I expanded this group. The Collapse/Expand control shows a minus sign ([- … …]) to signify it is expanded. Clicking the minus sign will hide the detail records for products with a category ID value of 6 and transform the control so that it shows as a plus sign [+].
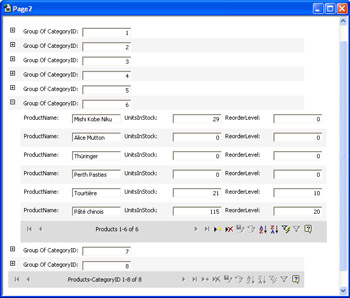
Figure 14.13: A two-level interactive report (dapExpandCategoryIDForProducts.htm) with an expanded group for the category ID of 6.
Notice that the report contains two navigation bars. The one with the label of Products 1 “6 Of 6 is the inner navigation bar. This bar does not appear unless a user expands at least one CategoryID group. By default, the maximum number of records that the bar shows at one time is 10. You can increase or decrease this amount by using the Properties dialog box for the navigation bar. The outer navigation bar appears whenever the data access page opens. Again, all 8 category ID values show at one time since there are fewer than 11.
Building a Three-Level Report
You can build multilevel reports from multiple record sources. Figure 14-14 shows a three-level report with CustomerID on the outer level, OrderID on the middle level, and fields from the Order Details table on the inner level. The complete report is available in this chapter's companion content. The standalone file is for the report dapThreeLevelReport.htm, which appears as dapThreeLevelReport in the Database window for Chapter14.mdb. This report design lets a user open the order details for any customer order. This interactive report depicted in Figure 14-14 shows the three line items for OrderID 10643 for the customer whose CustomerID is ALFKI. The figure displays the two inner navigation bars. The third outer navigation bar isn't visible in the figure. However, the outer navigation bar shows that there are 89 customers. This is two customers less than the number of rows in the Customers table since two customers have no orders.
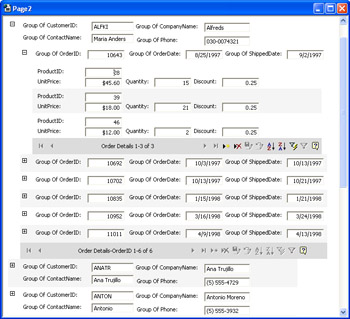
Figure 14.14: A three-level interactive report with an expanded group showing line items within OrderID groups, within CustomerID groups.
You can build a report like this one with three basic steps. A fourth step performs any report layout editing needed. These steps are as follows :
-
Add all the fields that you need in your report. Use the Relationship Wizard dialog box to define relationships between tables when you add the first field from a new record source. Don't try to add a table as a record source unless it already has a relationship to an existing record source for the report.
-
Select a field that you want to serve as the top-level field, and click the Promote tool. This creates a new section in the report and inserts the selected field into it. In the report shown in Figure 14-14, the top-level field is CustomerID . Move fields related to the top-level field ”such as CompanyName , ContactName , and Phone ”into the new section.
-
Select a field that you want to serve as the key field for the report's second tier . In this example, that field is OrderID . Then click Promote. This adds another new section to the report containing the selected field. Again, add related fields to the new section.
-
Perform whatever rearrangement and editing of control labels your application requires. For example, the sample report in Figure 14-14 aligned controls horizontally to conserve space so that you could see as much information as possible in a single screen.
Adding Calculated Fields to a Report
Including calculated fields in a report can improve the report's usefulness by providing summary information before a user expands a control or by deriving conclusions based on the available data. This section demonstrates how to use calculated fields in interactive reports to benefit from these advantages. In addition, this section shows how to replace numeric fields used for grouping with string values that are easier to read and interpret.
The starting point for this section is the dapExpandCategoryIDForProducts report we developed earlier. The example saves the report under a new name, dapCalculatedFields. It then makes three main edits to the report before resaving it. If you're authoring the report from the same workstation that stores the data access page for the interactive report, you'll have to revert from UNC notation for specifying the connection to a local drive designation. To achieve this, save the dapExpandCategoryIDForProducts report with a local drive designation and a name of dapCalculatedFields.
Once you have your copy of dapExpandCategoryIDForProducts saved as dapCalculatedFields, you can start editing the copy. Begin by replacing the text box that displays a different category ID value with the actual name of the category. This will make it easier for users unfamiliar with the category ID codes to interact with the report. Since the Products table does not include a CategoryName field, it's necessary to add a new record source to the data source control that manages data for the report.
Before adding a new record source, remove the text box and its label in the Products-CategoryID report section. Next, click the expand control for the Categories table in the Field List, and drag the CategoryName field just to the right of the expand control in the Products-CategoryID section. Then drag the edges of the bound span control for CategoryName and its label so that you can easily select either control. A bound span control displays the contents of a text or memo field, but it doesn't enable editing. This limitation is acceptable for a field that acts as a label. Select the bound span control, and change its TotalType setting on the Data tab of its Properties dialog box to dscNone . Use the drop-down list for the ControlSource property to select CategoryName . Update the Id setting on the Other tab of the Properties dialog box to bspCategoryName . Next, select the label for the bound span control. On its Other tab, type bspCategoryName_Label as its Id setting and Category Name: as its InnerText setting. Finish the editing for the bound span control and its label by positioning and sizing them the way you want on the report.
| |
Data access pages can have only two kinds of data sources: Access database files and SQL Server databases. This chapter focuses on the use of Access database files. However, you can also have a SQL Server database act as the data source for a page. It's possible to designate a SQL Server database as the source for a page even when you're authoring the page from an Access database file.
When you create a blank data access page, Access automatically assigns the local database as the source. If you're working from an Access database file and you want a SQL Server database to serve as the page's data source, click the Page connection properties control on the Field List. This opens a Data Link Properties dialog box. On the dialog box's Provider tab, select Microsoft OLE DB Provider For SQL Server. Complete the Connection tab for an Access project's Data Link Properties dialog box. Figure 14-15 shows the two tabs that designate the NorthwindCS database on the cabSony1 SQL server as the data source for a data access page.
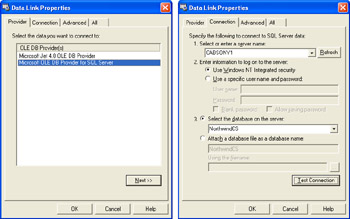
Figure 14.15: A pair of Data Link Properties tabs for setting the data source of a data access page to the NorthwindCS database.
When working with SQL Server data sources, you don't need to set the path to a database with UNC notation. This is because a SQL Server database specifies the connection to a data source in terms of the server name and the database's name on the server.
| |
Next, add another bound span control to the Products_CategoryID section that counts the number of product records within a category. You initially get this control from the Toolbox. Next, select the new bound span control, and open its Properties dialog box to the Data tab. Use the drop-down list for the ControlSource setting to designate ProductID . Then select dscCount from the TotalType setting. These two settings cause the bound span control to count the number of unique ProductID values within each category. On the Other tab, update the Id setting to bspCountOfProductID . Then select the label for the new bound span control. Change its InnerText value on the Other tab of its Properties dialog box to Count of Products and its Id setting to bspCountOfProductID_Label . In the Products-CategoryID section, adjust the size and position of the bound span control and its label until you get the results you want. In doing so, you might find it useful to set the TextAlign property of the bound span control to left . The setting is available on the Format tab of the control's Properties dialog box.
The last task is to add a computed field that tells the report user whether it's time to reorder a product. The report uses an expression that returns Yes whenever UnitsInStock is less than ReorderLevel . Otherwise, the expression returns No .
Before adding a new bound span control for the calculated field in the Products section of the report, rearrange the text box controls so that those for ProductName and UnitsInStock appear on the first row and the text box for ReorderLevel appears in the second row along with the new bound span control. Type the following expression into the ControlSource property for the bound span control. Notice that it relies on a familiar Immediate If statement.
ReorderNow:IIf(UnitsInStock<ReorderLevel,"Yes","No")
Next, change the InnerText setting for the bound span control's label to Reorder? This property assignment cryptically asks the question, "Is it time to reorder?" The expression on the bound span control's ControlSource property answers this question. Also, assign bspReorderNow to the control's Id setting. This Id setting will demonstrate its usefulness with the code sample in the next section.
Complete the application with the normal resizing and repositioning . You might also want to assign a title for the page. In HTML, you set this property to determine the contents of the browser's title bar when it opens a page. You will also notice the property when you examine a data access page in Page view. To assign a value to the page's Title property, click the page's title bar in Design view. Then open the Properties dialog box. On the Other tab, type a name that reflects the page's purpose or role, such as dapCalculatedFields . Finally, save the page with UNC notation that designates its connection to the database file. A completed version of the report is available with this book's companion content in the dapCalculatedFields.htm file.
The report in Figure 14-16 illustrates the outcome of the enhancements to the dapExpandCategoryIDForProducts data access page presented in Figure 14-13. Notice that the labels describing the products within a category show the name of the category rather than a CategoryID code number. In addition, users can tell how many products are in a category without opening that category to get the information from the inner navigation bar. Finally, the report computes whether it's time to reorder a product and displays the results with a Yes or No.
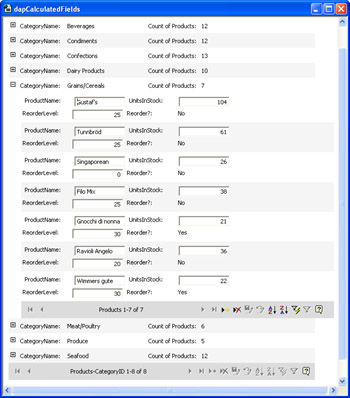
Figure 14.16: With calculated fields, you can dramatically improve the ease of interpreting an interactive report.
Applying Conditional Formatting to a Report
As improved as the report in Figure 14-16 is over the one in Figure 14-13, if there was a long list of products within a category, it might be difficult to see which products need a new order. One way to resolve this is to apply a bold font selectively to the computed value for reordering . The event procedure in this section applies a bold font to those products with a value of Yes , which serves as an answer to the question about whether it's time to reorder. Figure 14-17 shows another version of the report (dapExpandReportandFormat) with conditional formatting of bold for products with a bspReorderNow value of Yes . See how much easier it is now to tell which products need a new order?
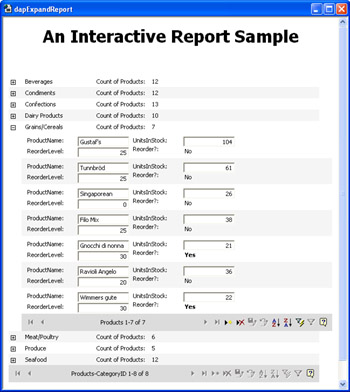
Figure 14.17: You can improve readability by implementing conditional formatting with an event procedure for the data source control in a data access page.
This improved readability results from an event procedure for the page's data source control. Each time a user opens a child section of a report, the data source control on the page reloads the page. The data source control (MSODSC) is a top-level object in the data model for a page. The following event procedure fires when the data source control for the report page finishes reloading in response to a user opening the products within a category. The procedure loops through the sections on a page. The NextSibling property allows the procedure to advance from one section of a report to the next. When any HTML controls fall within a section that has a value of RecordLevel greater than UnitsInStock , the procedure assigns a bold font to the bspReorderNow control.
<SCRIPTevent=DataPageComplete(dscei)for=MSODSClanguage=vbscript> <!-- 'Highlightitemsthatarealmostoutofstock dimsect dimdscconst dimbandHTML 'CheckthateventfiredforDataPageintheProductsGroupLevel if(dscei.DataPage.GroupLevel.RecordSource="Products")then setdscconst=MSODSC.Constants setsect=dscei.DataPage.FirstSection 'Gothroughthesectionsoftheevent'sDataPageobject do 'Wanttoignorethecaptionsection if(sect.Type=dscconst.sectTypeHeader)then setbandHTML=sect.HTMLContainer 'ConditionalformattingonthebspReorderNowcontrol. 'ChangethetexttoboldiftheReorderLevelis 'greaterthanUnitsInStock. if(CInt(bandHTML.children("ReorderLevel").innerText)>_ CInt(bandHTML.children("UnitsInStock").innerText))_ Then bandHTML.children("bspReorderNow").style.fontweight_ ="bold" endif endif setsect=sect.NextSibling loopuntil(sectisnothing) endif --> </SCRIPT> You type the script similarly to the way described earlier in this chapter for the onchange event procedure. Open the Script Editor. Select the Script Outline view of the Document Outline window. Then expand the events for MSODSC, which represents the data source control object on a page. Double-click the DataPageComplete event. This opens the shell for the event procedure. Finally, copy the body of the event procedure into the shell.
EAN: 2147483647
Pages: 144