SQL Application Tuning
After you’ve created the optimal tables, indexes, and other database objects, the next step in your quest to improve the performance of the database is to review the users’ SQL commands. You can use some of Oracle’s GUI-based tools, such as Top SQL and Explain Plan, to identify and analyze the SQL commands that are not only frequently executed but also use the most resources. Also, you can help the Oracle optimizer do its job of deciding the best way to run a specific query.
Top SQL Tool
The Top SQL tool can identify SQL statements that may be causing performance problems in the database, such as by using too much CPU or reading blocks from disk instead of from the cache. Even if the SQL command itself does not use many resources, it may still be a candidate for tuning if it is executed hundreds of times an hour!
Top SQL tool
A GUI-based Oracle tool that can identify SQL statements that may be consuming too many system resources and therefore may be good candidates for tuning.
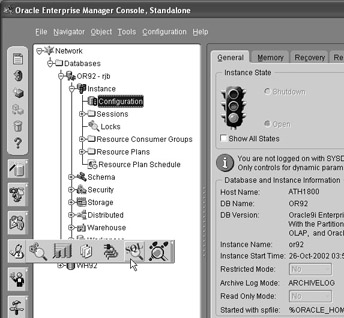
The Top SQL tool is available through the Oracle Enterprise Manager (OEM) console, via the Diagnostics Pack pull-out, as shown below.
The Top SQL tool shows a number of statistics for each SQL command executed, such as disk reads, buffer reads (data is already available in the buffer cache and does not need a read from disk), CPU time used, and the number of executions. The following illustration shows an example of a Top SQL window.
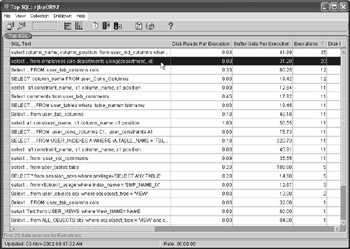
In this example, the SQL statement that joins the EMPLOYEES and DEPARTMENTS table has a high number of executions relative to the other user and system SQL statements. It may be a good candidate for analysis, even though all of the data the query needed was already in memory, as indicated by the Disk Reads Per Execution statistic.
Explain Plan Graphical Tool
The Explain Plan tool can be launched directly or from the Top SQL tool. It shows in a step-by-step fashion how a SQL statement is processed and how each of the tables in the query is accessed—for example, by an index or by reading the entire table. With the statement in question highlighted in the Top SQL window, select Drilldown > Explain Plan to bring up the Explain Plan analysis window, as shown on the next page.
Explain Plan tool
A GUI-based Oracle tool that details the steps in which a SQL statement is executed, as well as what method Oracle used to access the tables in the query.
The Explain Plan window is divided into three horizontal sections. The SQL statement itself is displayed in the top third of the window. The steps that Oracle uses to execute the statement are in the middle third of the window. As each step is selected, a brief explanation of what occurs in that step is detailed in the bottom third of the window.
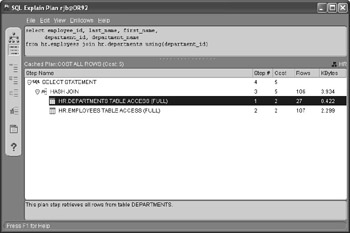
In the case of the join between the EMPLOYEES and DEPARTMENTS table in this example, both tables are accessed with a full table scan instead of an index. This make sense because the query retrieves most, if not all, of the rows in both tables. If there were a limiting condition in a WHERE clause, and the tables were still accessed by a full table scan, then it might indicate that you are missing an index on one or both of the tables.
The Oracle Optimizer
As the old saying goes, “All roads lead to Rome.” In the case of a SQL query, there are many different ways that a query—even a query on a single table—can be processed. It’s the job of the Oracle optimizer to choose the best way to run a query.
Oracle has two optimizer modes: rule-based and cost-based. We’ll talk about the differences between those two modes, as well as two different ways to assist the optimizer in finding the best way to run a query.
Rule-Based Optimization
The older rule-based optimizer mode uses a fairly simple set of guidelines to decide how a query is run. It will use an index, regardless of the size of the table. Also, it ignores the cardinality of the columns being accessed, even if the cardinality would otherwise indicate that most of the table will be scanned for the results anyway.
rule-based optimizer
An Oracle optimizer methodology that relies on a fixed set of rules to determine the method used to run a query, ignoring the cardinality and distribution of data in the column being queried.
Why would you use the rule-based optimizer? Some older Oracle applications might run better since they were written to specifically exploit some of the behaviors of the rule-based optimizer. Otherwise, Oracle strongly recommends that cost-based optimization be used in all new development environments.
You can set the optimizer mode to rule-based for the session with the ALTER SESSION command:
alter session set optimizer_mode=rule; Session altered.
Cost-Based Optimization
The cost-based optimizer is much more sophisticated than the rule-based optimizer. It takes into consideration the cardinality of the columns being searched, the potential I/O cost, estimated CPU cost, and sorting cost. The cost-based optimizer will ultimately use the method that has the lowest overall cost, even if it means not using an index on one or more of the columns being searched.
cost-based optimizer
An Oracle optimizer methodology that relies on the characteristics of the tables being queried to determine the method used to run the query. A cost is calculated for estimated CPU, I/O, and sorting for the possible execution paths. The path with the lowest overall cost is used to perform the query.
You can tell Oracle to pick which optimizer mode to use for the session with the ALTER SESSION command:
alter session set optimizer_mode=choose; Session altered.
The CHOOSE keyword means that Oracle will decide whether to use the rule-based optimizer or the cost-based optimizer. When analyzing a SQL statement, the optimizer may use a rule-based approach for calculating the CPU cost, but may use the cost-based approach for all other calculations. Notice that you cannot specify optimizer_mode=cost: the optimizer will always use cost-based optimization if at least one of the tables in the query has statistics and the optimizer mode is set to choose. The optimizer will estimate statistics on-the-fly for any tables in the query that don’t already have them. A table’s statistics are a set of predetermined characteristics stored in the data dictionary, such as those mentioned above: the cardinality of the indexed columns in the table, the number of rows in the table, the distribution of values in an indexed column, and so forth. Calculating statistics for some or all of the tables in the query will have the same effect as forcing cost-based optimization.
statistics
Information about tables and indexes stored in the data dictionary used to assist the cost-based optimizer when deciding how to run a given query.
Therefore, to effectively use the cost-based optimizer, it is important to have statistics calculated on the tables present in the SQL statement. We will talk about statistics gathering in the next section.
Gathering Statistics
The cost-based optimizer relies on the cardinality of columns in the table, the size of the table, the number of rows in the table, the length of each row in the table, and other statistics. By default, these statistics are not stored anywhere in the database. You can use the ANALYZE command to store these statistics in the data dictionary for use by the cost-based optimizer.
In general, it is recommended that you analyze all rows of a table and its indexes, but if the table is very large, you might analyze the indexes separately. Alternatively, you can calculate statistics on a subset of the rows in the table by using the ESTIMATE STATISTICS option of the ANALYZE command. ESTIMATE STATISTICS will use about 1,000 rows to calculate its statistics, and in many cases, it is nearly as accurate as scanning the entire table.
To gather the statistics for the EMPLOYEES table and all of its indexes using a sample of all rows, use the following command:
analyze table employees estimate statistics; Table analyzed.
Statistics are not automatically refreshed when rows are inserted or updated; however, unless the table dramatically changes in size or in the cardinality of the indexed columns, the statistics are still useful to the cost-based optimizer. However, statistics gathering should be scheduled to run on a regular basis in order to provide the cost-based optimizer with the best information available.
Optimizer Hints
As good as the Oracle optimizer is, it is not perfect. For example, even with the best statistics, the optimizer may not choose an index; however, your experience tells you that the types of queries users are running recently may use a very narrow range in the index, so using the index has an advantage over a full table scan. In this case, it is prudent to override the optimizer and provide a hint as part of the query.
hint
A directive placed between /*+ and */ in a query that overrides an execution method that the Oracle optimizer would normally choose.
Insert the hint after the SELECT keyword, between the character strings /*+ and */. There are more than 40 hints available in Oracle. Common hints include the INDEX hint to specify that a particular index is used in a query and the REWRITE hint to force a materialized view to be used to resolve the join condition in the query instead of using the base tables.
| Warning | If the hint is misspelled or otherwise incorrect, it is ignored. Therefore, it is important to double-check the syntax of any hint you provide in a SQL statement. |
To force the optimizer to use the index EMP_NAME_IX on the EMPLOYEES table, use the INDEX hint, as follows:
select /*+ index(employees emp_name_ix) */ employee_id from employees where last_name = ‘King’;