Failure Intensity
| Having a quantifiable definition of reliability, such as failure intensity, is the key to being able to measure and track reliability during testing as a means of helping decide if you have reached that sweet spot in testingnot too early, not too latewhen it is time to release your product. In this section, you will learn:
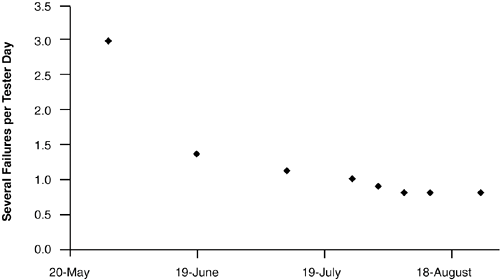
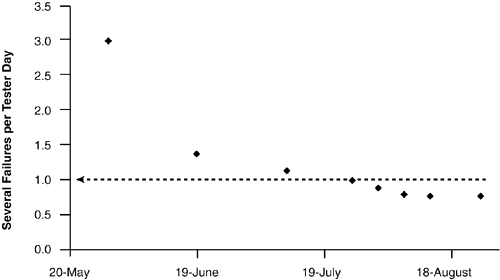
Visualizing Failure Intensity with a Reliability Growth CurveA good way to visualize how failure intensity works as a decision aid for when to stop testing is to look at a run chart of failure intensity through time. Figure 4.1 shows a run chart of failure intensity for a large product over a period of about three months from the start of system test to end, at which time the product was released. Figure 4.1. A reliability growth curve is a run chart of a system's failure intensity through time.
Each point on the run chart in Figure 4.1 calculates the failure intensity to that point in testing (date of measure is provided on X-axis). Failure intensity (Y-axis) is calculated as the number of failures of a specified severity per unit of time; in Figure 4.1, it is severe defects per tester day.[3] Sticking with failures of a specified severity is important. As testing proceeds, it is quite possible that the total number of "failures" doesn't necessarily drop significantly; rather, it's the mix of severity types that is changing. Early in testing, the mix will contain a high percentage of severe failures. Toward the end of testing, the percent of severe failures will drop (hopefully) but the number of minor failures reported could very well increase such that the total count is constant.
Run charts of failure intensity, such as that of Figure 4.1, are commonly called reliability growth curves. One objection I sometimes get when I show a team a reliability growth curve like that of Figure 4.1, say in a project postmortem, is that it seems counterintuitive for the trend line to go down as an indicator that reliability is increasing. A related measure of reliability that is often used in hardware, Mean Time To Failure (MTTF), is the inverse of failure intensity:
If you would prefer to see a graph trend line that goes up, try plotting MTTF.[4]
Selecting a Unit of Measure for Failure IntensityFailure intensity is a measure of failures per unit of time. What you use for a unit of time depends on what makes sense for your product and what you can measure in a practical way. Musa et al. (1990) identifies execution timethe amount of time the CPU is actually executing instructionsas the preferred unit of measure for best results, but practically speaking, this is difficult for the vast majority of testing organizations to measure. For some applications, it might even make sense to use a non-time-based measure, for example, failures per number of transactions. For many testing groups, the easiest thing to measure failures against is testing effort because that is something they are already accustomed to tracking for budget accounting. So, for example, three testers running separate testing efforts for a day would be three tester days of effort. Some care, of course, needs to be taken to account for the actual amount of time spent testing as opposed to attending staff meetings, setting up of hardware, and so on. As previously noted, the run chart of Figure 4.1 was created using failure intensity based on testing effort (i.e., tester days). Setting a Failure Intensity ObjectiveHaving a quantifiable definition of reliability, such as failure intensity, allows us to not only measure and track reliability during testing but also set quality goals in terms of that definition. This is done by setting a failure intensity objective. In Figure 4.2, the dotted line illustrates a failure intensity objective of one severe defect per tester day as the project's goal for reliability. In this case, the team's goal was to get under this threshold, and the product actually released with a failure intensity of about .80 severe defects per tester day. Figure 4.2. Failure intensity objective set at one severe defect per tester day.
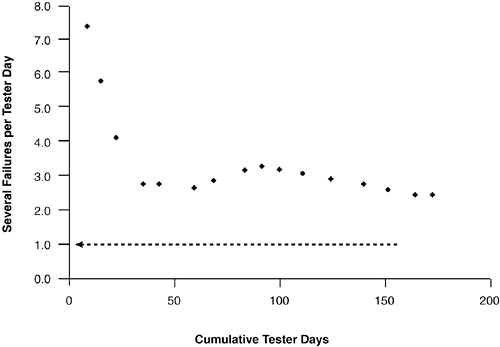
Remember, tester day is a measure of work, not elapsed time. Some testing groups prefer to work in terms of tester hours, which has the advantage of not being ambiguous as to how many hours a tester day represents. The reliability growth curve is not always as clean as that shown in Figure 4.2. More often than not, in the messy world of real life development and testing, you will find curves that look more like that of Figure 4.3, where reliability actually gets worse at points (humps in the curve) and seems to stubbornly refuse to converge on your stated failure intensity objective as the scheduled release date looms near. The product whose reliability growth curve is shown in Figure 4.3 was released with failure intensity just under 2.5 severe defects per tester day (failure intensity objective was 1.0 as indicated by arrow), i.e., schedule pressure forced release of the product before the reliability goal was met. Figure 4.3. Reliability growth curves are not always neat "curves" converging on your failure intensity objective.
Figure 4.3 also illustrates the plotting of failure intensity where cumulative time (here tester days) is used for the X-axis rather than calendar time on the X-axis as in Figure 4.2. Which you use is a matter of taste. I like to see calendar time on the X-axis because the spacing between points can sometimes tell a story of their own (e.g., when IT decides to upgrade build servers in the middle of the project shutting down development and testing for two weeks. This will show up on the run chart as a glaring gap between points, a reminder to never let them do that again). The danger of using calendar time on the X-axis is that it can confuse you into thinking failure intensity is in terms of calendar time. But What's the Right Failure Intensity Objective?In Figure 4.2, we saw an example of a project where the failure intensity objective was set for one severe defect per staff-day of testing, as illustrated by the dotted line. But how do you know what is the right failure rate to use as your objective? There are of course lots of factors that play into this. For example, who are your customers, and what do they want in terms of reliability? Depending on where your product is in the technology adoption life cycle (Moore 1991) your customer's tolerance for unreliable productsor lack thereofwill change. New products often have customers that are innovators and early adopters and may be more concerned with early availability and new features than having to work around an occasional crash or two. On the other hand, mature products often have customers that demand rock-solid reliability. In the following sections, we'll look at three ideas for helping you set failure intensity objectives. We'll look at a couple of high-tech approaches for identifying failure intensity objectives for individual use cases and will then conclude with a low-tech approach for setting a failure intensity objective for a whole component or whole product; it may be a good 20/80 approach for you to use delivering 80% of the benefit for 20% of the effort. Setting Failure Intensity Objectives Based on Severity of FailuresA way to set failure intensity objectives for each individual use caseor all use cases associated with a given componentis to derive them based on an analysis of severity of failures. In this approach, we start with what is bearable in terms of failuressay, costthen work backwards to determine the corresponding failure intensity. In the previous chapter, we looked at profiling a package of use cases where the risk exposure of each use case was taken into account. Figure 3.25 illustrated the calculation of the risk exposure for each use case of the sales order component by taking the frequency of failure, stated in opportunities for failure per day, times severity, stated in dollars to resolve per failure. Risk exposure was measured in dollars per day and represents the risk in dollars to run a use case for the day; we calculated risk exposure for the entire use case package at $141,340 daily. Remember, that doesn't mean that is how much money you are necessarily losing each day; it is the potential loss you are exposed to from running the package of use cases. It's the loss you would incur daily if every use case run resulted in a severe failure. We know that we can't afford to lose $141,340 a day due to failures in our sales order system; in terms of failure intensity objectives, that just means that a severe failure on 100% of use case runs is not acceptable. But what amount of money are we willing to lose to run our sales order system? Musa et al. (1990) provide examples of calculating the financial cost of a given failure intensity objective, but the calculation can also be done the other way (i.e., starting with what is financially a bearable cost for support of failures and then working backwards to determine the corresponding failure intensity). While this is a difficult way for us to think about our products (no one likes to admit their system is imperfect) it is the approach you need to take in order to set failure intensity objectives based on the severity of failures. Unrealistic answers (e.g., "How about a penny a day?") will result in reliability goals that you will pay for dearly trying to achieve in terms of development and testing. To keep it simple, let's say that you are willing to lose $1,000 daily in support of failures in our sales order system. That figure$1,000 a dayis about seven tenths of a percent (.7%) of the total risk exposure of $141,340. Translated into failure intensity, it means that you are willing to live with seven tenths of a percent of the use case runs resulting in a severe failure. With this, you are now able to construct the spreadsheet table shown in Figure 4.4; the information on opportunities for failure a day and cost to resolve each failure comes from the profile in Figure 3.25. Figure 4.4. Spreadsheet to calculate failure intensity objectives per use case based on failure severity.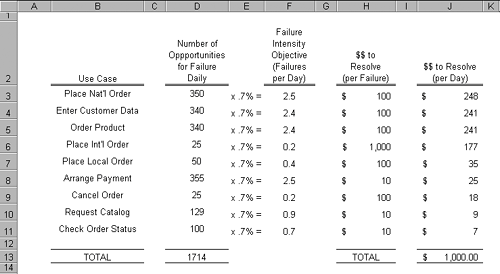 Column FFailure Intensity Objectivesimply calculates the upper bound on the number of times a day we are willing to have each use case fail in a severe way. Column J$$ to Resolve (per Day)calculates the subsequent daily cost of fixing those failures, with a bottom-line total of $1,000 daily for the package of use cases. So, to summarize, in this approach we start with what is financially a bearable cost for support of failures, then work backwards to determine the corresponding failure intensity. Setting Failure Intensity Objective Using the Exponential Failure LawFailure intensity and its inverse Mean Time To Failure (MTTF) are measures of the average behavior of systems. When we say a widget is expected to fail once in 3 years (i.e., has a MTTF of 3 years) what we are really saying is that widgets of that type on average will last for 3 years; some more, some less. The name itself tells us that: Mean Time To Failure (i.e., the average time to failure). Sometimes, statements about average behavior are not good enough and we need to say something stronger about our requirements for reliability. Let's take an example from the world of product warranties. Let's say you manufacture and sell widgets that come with a three-year warranty. You have done an analysis of what it costs to do warranty repairs on failed widgets and have determined that you need to have 75 percent of the widgets outlive the three-year warranty; otherwise, repair costs of failed widgets still under warranty start eating into profits. What MTTF do your widgets need to have to ensure that 75 percent will run longer than the three-year warranty? For this type of problem, you need to return to the exponential failure law (refer to Equation 4.1) and rewrite the equation so that you can solve for the failure intensity l (see Equation 4.3). Equation 4.3 Exponential failure law re-written to solution for failure intensity.
Interpreting Equation 4.3 in terms of our widget warranty problem, it reads: The failure intensity, l, of our widgets needs to equal the natural logarithm ("ln") of one over the desired percent of widgets we need to have survive the warranty, R( You probably aren't going to want to have to remember that formula or calculate it by hand; that's why we have spreadsheets! The spreadsheet in Figure 4.5 shows how to implement Equation 4.3 and computes the target failure intensity and corresponding inverse MTTF for widgets designed such that 75% will outlive a three-year warranty. Figure 4.5. Calculating failure intensity objective for widgets with a three-year warranty based on the need to have 75 percent survive the warranty period. "LN" is the natural logarithm function in Excel. What the spreadsheet in Figure 4.5 is telling us is that for a type of widget to reliably (75% of the time) outlast its warranty of three years, it has to be designed with a failure intensity of one failure in 10 years, i.e., a MTTF of 10 years. You can see what is going on here: Because failure intensity and MTTF are averages, the exponential failure law tells us we have to boost the "ruggedness" of the widgets such that their average behavior returns our required above-average result of 75% reliability. Simply put, it takes a widget designed for an average life of 10 years to be 75% reliable for three years. The same principle works with use cases. By their nature, use cases take time to run. Some span seconds, some minutes, and some hours or longer, their duration a function of granularity, but more so of the application domain. In the development of systems to help geologists and geophysicists find oil and gas reservoirs, it is not uncommon to have a use case in which a single step corresponds to behind the scenes processing (which the user does not see) of large amounts of seismic data, or the simulation of the movement of fluids in a reservoir deep in the earth, both quite often measured in hours. Let's take the widget warranty example and reapply it to use cases. Imagine a use case called Log Call that is part of a police station's 911 PBX system. A typical police station that buys such a system usually runs from 1 to 10 terminals each staffed with an operator. When a call comes in, the operator records the details of the call: name, location, nature of emergency, and so on. Based on analysis of peak call volumes, the reliability goal for the Log Call use case is that at least 80 percent of the deployed PBX terminals should be able to take a 30-minute call without failure. If a failure occurs on a given terminal while running the Log Call use case, the operator can then transfer the call to another terminal (another use case) with minimal wait time resulting for the caller. What then is the failure intensity objective you should use in developing and testing the Log Call use case? The spreadsheet in Figure 4.6 shows the calculation. Figure 4.6. Calculating the failure intensity objective for the PBX's Log Call use case.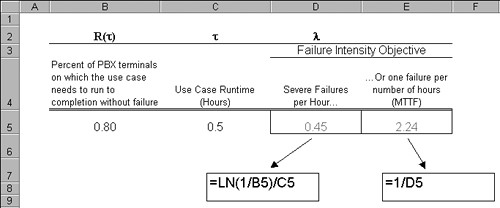 The spreadsheet in Figure 4.6 tells you that during development of the Log Call use case you will need to continue testing and fixing defects that result in severe failures until the observed failure rate is at or less than one severe failure per 2.24 hours of use case run time, or .45 severe failures per hour. One advantage to this approach is that the MTTF number it calculates holds some useful information about how many tests and the test time a use case may require to demonstrate the reliability goal has been met. Assume for a moment that the implemented Log Call use case was defect free; hence, failure free. How many tests would it take to simply demonstrate that Log Call was capable of running 2.24 hours without a failure? You'd need enough tests to stretch out the runtime to 2.24 hours (running one test over and over doesn't count). So looking at the MTTF from a testing standpoint, it provides a minimum amount of time you need to test the use case if you really want to demonstrate the use case's reliability is at the 80% level. But this also points out a key limitation of testing as a way to demonstrate reliability. Storey (1996) points out in his discussion of reliability assessment that some systems in the safety-critical arena have reliability goals so high (e.g., one failure in 100,000 years) that the use of testing to demonstrate reliability is for practical purposes impossible. Low-Tech ApproachMany, if not most, software development organizations may not be ready to try to set Failure Intensity Objectives in terms of analysis of severity of failures or by use of the exponential failure law. Here's a simple low-tech approach you might find useful for setting failure intensity objectives for whole components or even whole products; it may be a good 80/20 solution providing a lot of bang for the buck. Think back to a project that you and your team remember as being successful and that you believe was well received by the customer in terms of reliability. Do a little project archaeology and find out the total number of defects of a specified severity that were found during system test. Divide that number by the amount of time that was expended during testing to find those defects. Use execution time, staff time running tests, or even DB transactions or orders processed; whatever unit of measure works best for your failure intensity. That should give you a ballpark candidate failure intensity objective. Here's an example. Figure 4.7 shows a spreadsheet constructed from the defect tracking database and test reports of a project as part of its project postmortem. For this project, the cumulative number of severe defects found was 582, with 375 staff days expended on testing, for an overall failure intensity of 582 / 375 = 1.55 severe defects per tester day. Figure 4.7. Spreadsheet calculating failure intensity for project as a whole based on information from defect tracking tool and testing reports. This product released with a cumulative failure intensity of 1.55 severe failures per tester day.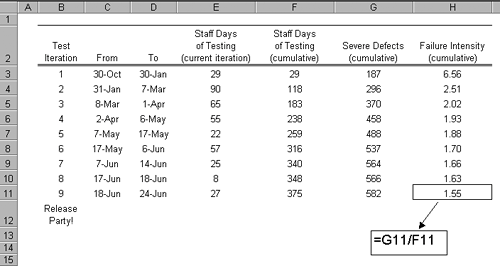 Besides being simple, this approach has another benefit. One complication that most testing organizations are likely to face is the correlation between testing and customer use (i.e., how does some unit of time spent in testing relate to the same unit of time in the field). Chances are, your product testing is not going to be directly equivalent to the use the product will experience in the field; it will either be more rigorous (hopefully) or less rigorous, but probably not exactly the same. In either casemore rigorous or lessthere will be a question of how failure intensities in test compare to those that users will experience. This approach of working from some past successful project has the benefit of giving you a failure intensity objective that already correlates well with the use of a happy customer. In the final analysis, arriving at a failure intensity objective that is right for your line of business, your products, and your customers may involve some trial and error. At the end of this chapter we'll look at a metric to help measure the success of a testing process' defect removal. By tracking failure intensities during testing, followed by analysis of defect removal metrics after release, you should be able to determine whether you can raise, or need to lower, failure intensity objectives. We'll actually revisit the release of Figure 4.7 and determine whether or not a failure intensity of 1.55 severe defects per tester day was indicative of a good release. |
EAN: 2147483647
Pages: 109


 .
.