11.3 Creating monitoring thresholds using the Monitoring tab
|
| < Day Day Up > |
|
The Properties for each system running Exchange includes a Monitoring tab where you can establish the warning or critical state thresholds to monitor. For example, the Monitoring tab can be used to notify you if the available disk space decreases to less than a specified amount or if the central processing unit (CPU) use exceeds a specified level. Once you have established the thresholds for your Exchange servers, you can quickly view the status of each of your Exchange servers by using the Status feature of ESM (see Section 11.4). You should routinely use the Status feature to ensure that the Exchange servers are functioning within their planned parameters and do not require additional resources. You can also be notified automatically whenever a threshold is reached. Automatic notification is discussed later in Section 11.5.
The following procedure can be used to establish thresholds for your Exchange servers.
-
Start ESM from the Windows Start menu by selecting All Programs →Microsoft Exchange →System Manager.
Note By default, administrative groups and routing groups are not displayed. If you have not already enabled these, right-click on the Exchange organization and select Properties to display the organizational properties. Select the Display administrative groups check box to allow the administrative groups to be displayed, and select the Display routing groups check box to display the routing groups. You must restart ESM after enabling display of administrative groups and routing groups.
-
Expand the Administrative Groups section.
-
Expand the administrative group (e.g., First Administrative Group) that contains the server you want to monitor.
-
Expand the Servers section.
-
Right-click on the server you want to monitor, and select Properties.
-
Select the Monitoring tab (Figure 11.1).
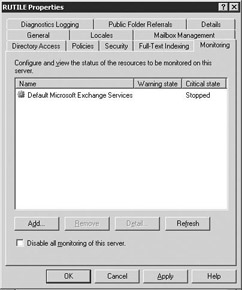
Figure 11.1: Server Properties - Monitoring tab -
To monitor an additional server resource, select Add (Figure 11.2).
-
You can monitor available virtual memory, CPU use, free disk space, SMTP queue growth, Windows services, or X.400 queue growth. Select one of the resources from the list and then select OK. The next window displayed will vary depending on the resource you chose to monitor.
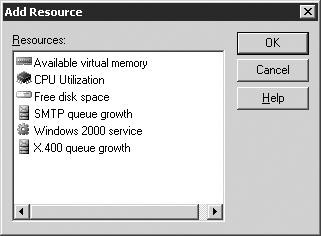
Figure 11.2: Add Resource dialog box
11.3.1 Available virtual memory
If you select Available virtual memory, the Virtual Memory Thresholds window will open (Figure 11.3). You can use this dialog box to specify when warnings, critical states, or both are issued for a system's virtual memory.
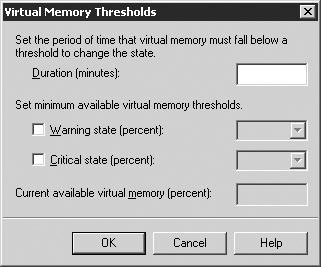
Figure 11.3: Virtual Memory Thresholds dialog box
Exchange may stop responding or may respond very slowly when a system's available virtual memory becomes too low.
-
In the Duration (minutes) field, enter the number of minutes that the percentage of available virtual memory must be continuously below the threshold values before a warning or critical state is issued. Even under normal circumstances, a server's available virtual memory can decrease to low levels for short periods. The value you enter into the Duration ( minutes) field should not be so small that it triggers warning or critical states for normal, short-duration events.
-
To set a warning state limit, select the Warning state (percent) check box and select a value from the associated drop-down list to specify the percentage of available virtual memory that must remain before a warning state is issued. The warning state is issued if the available virtual memory remains less than the selected percentage for the number of minutes specified in the Duration (minutes) field.
-
To set a critical state limit, select the Critical state (percent) check box and select a value from the associated drop-down list to specify the percentage of available virtual memory that must remain before a critical state is issued. The critical state is issued if the available virtual memory remains less than the selected percentage for the number of minutes specified in the Duration (minutes) field. The Critical state (percent) value must be smaller than the value specified for the Warning state (percent).
The Current available virtual memory (percent) value is not displayed when you are adding a new monitor. However, once you have created a virtual memory monitor, you can view the current available virtual memory by double-clicking the Virtual memory threshold monitor on the server's Monitoring tab. You can use this to establish a baseline that will help you understand the normal load.
11.3.2 Central processing unit utilization
If you select CPU Utilization, you can use the CPU Utilization Thresholds dialog box to specify when warning, critical states, or both are issued for CPU utilization (Figure 11.4). Exchange may stop responding or may respond slowly when a system's CPU utilization is too high.
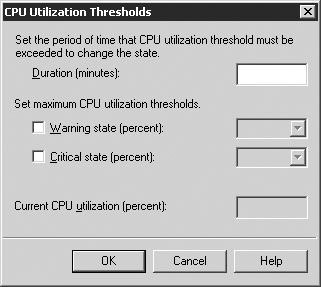
Figure 11.4: CPU Utilization Thresholds dialog box
-
In the Duration (minutes) field, enter the number of minutes that the CPU utilization must be continuously above the threshold values before a warning or critical state is issued. Even under normal circumstances, a server's CPU utilization can increase to temporarily high levels. The value you enter into the Duration (minutes) field should not be so small that it triggers warning or critical states for normal, short-duration events.
-
To set a warning state limit, select the Warning state (percent) check box and select a value from the associated drop-down list to specify the maximum CPU utilization that must be reached before a warning state is issued. The warning state is issued if the CPU utilization remains above the selected percentage for the number of minutes specified in the Duration (minutes) field.
-
To set a critical state limit, select the Critical state (percent) check box and select a value from the associated drop-down list to specify the maximum CPU utilization that must be reached before a critical state is issued. The critical state is issued if the CPU utilization remains above the selected percentage for the number of minutes specified in the Duration ( minutes) field. The Critical state (percent) value must be greater than the value specified for the Warning state (percent).
The Current CPU utilization (percent) value is not displayed when you are adding a new monitor. However, once you have created a CPU utilization monitor, you can view the current CPU utilization by double-clicking the CPU threshold monitor on the server's Monitoring tab.
11.3.3 Free disk space
If you select Free disk space, you can use the Disk Space Thresholds dialog box (Figure 11.5) to specify when warning, critical states, or both are issued for available disk space.
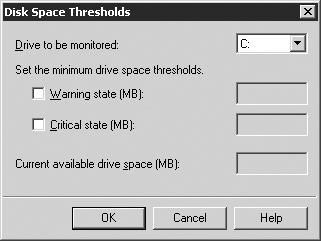
Figure 11.5: Disk Space Thresholds dialog box
-
Use the Drive to be monitored drop-down list to select the drive where disk space will be monitored. Mapped network drives cannot be monitored.
-
To set a warning state limit, select the Warning state (MB) check box and enter a value in the associated field to specify the minimum amount of disk space (in megabytes [MB]) that must be available before a warning state is issued. The warning state is issued if the available disk space decreases to less than the specified value.
-
To set a critical state limit, select the Critical state (MB) check box and enter a value in the associated field to specify the minimum amount of disk space (in MB) that must be available before a critical state is issued. The critical state is issued if the available disk space decreases to less than the specified value. The Critical state (MB) value must be less than the value specified for the Warning state (MB).
The Current available drive space (MB) value is not displayed when you are adding a new monitor. However, once you have created a free disk space monitor, you can view the current available disk space by double-clicking the Free space threshold monitor on the server's Monitoring tab.
11.3.4 Simple Mail Transfer Protocol queue
Select SMTP queue growth to display the SMTP Queue Thresholds window (Figure 11.6). If an SMTP queue grows continuously, e-mail is not leaving the queue and is not being delivered in a timely manner to other systems.

Figure 11.6: Simple Mail Transfer Protocol Queue Thresholds dialog box
An SMTP queue that grows continuously may be an indication that a connector is not working properly or that there are problems with the underlying network. You can use this dialog box to specify when warning, critical states, or both are issued for the SMTP queue.
-
To set a warning state limit, select the Warning state (minutes) check box and enter a value in the associated field to specify the number of minutes that the queue can grow continuously before a warning state is issued.
-
To set a critical state limit, select the Critical state (minutes) check box and enter a value in the associated field to specify the number of minutes that the queue can grow continuously before a critical state is issued. The Critical state (minutes) value must be greater than the value specified for the Warning state (minutes).
The Current queue growth (minutes) value is not displayed when you are adding a new monitor. However, once you have created an SMTP queue growth monitor, you can view the current queue growth by double-clicking the SMTP queue growth period monitor on the server's Monitoring tab.
11.3.5 Windows service
If you select Windows 2000 service, you can use the Services dialog box to specify Windows services you want to monitor (Figure 11.7). You can issue a critical or warning state when the service is not running.
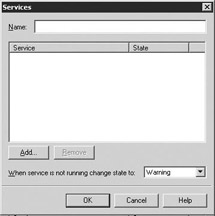
Figure 11.7: Services dialog box
-
In the Name field, enter a name for this service monitor. You should use a name that is meaningful and will help you quickly remember the type of services that are being monitored. For example, if you are monitoring the Exchange Message Transfer Agent (MTA) stacks, Exchange routing engine, Exchange site replication service, and others, you might want to use a name such as 'Exchange Core Services.' If you are monitoring the antivirus services, the backup services, and so on, you might want to use a name such as 'Exchange Support Services.'
-
Use the Add button to add a Windows service to the list of those services being monitored. An Add Service dialog box (Figure 11.8) will be displayed. The Add Service dialog box contains a complete list of services that can be monitored. This includes all of the Exchange services, plus additional Windows services. Select a service and select OK to add the service to the list. You can add additional services to the list by using the Add button again. The service list will include each of the services you selected and the associated state (i.e., Running or Stopped) for each service.
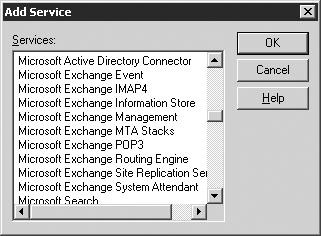
Figure 11.8: Add Service dialog box -
Use the When service is not running change state to drop-down list to specify whether a warning state or critical state will be issued when any of the selected services is not running.
11.3.6 X.400 queue
If you select X.400 queue growth, the X.400 Queue Thresholds dialog box will open (Figure 11.9). If an X.400 queue grows continuously, e-mail is not leaving the queue and is not being delivered in a timely manner to other Exchange 5.5 or X.400 systems. A queue that grows continuously may be an indication that a connector is not working properly or that there are problems with the underlying network. You can use this dialog box to specify when warning, critical states, or both are issued for the X.400 queue.
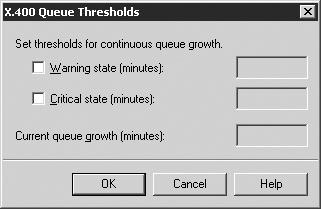
Figure 11.9: X.400 Queue Thresholds dialog box
-
To set a warning state limit, select the Warning state (minutes) check box and enter a value in the associated field to specify the number of minutes that the queue can grow continuously before a warning state is issued.
-
To set a critical state limit, select the Critical state (minutes) check box and enter a value in the associated field to specify the number of minutes that the queue can grow continuously before a critical state is issued. The Critical state (minutes) value must be greater than the value specified for the Warning state (minutes).
The Current queue growth (minutes) value is not displayed when you are adding a new monitor. However, once you have created a queue growth monitor, you can view the current queue growth by double-clicking the X.400 queue growth period monitor on the server's Monitoring tab.
|
| < Day Day Up > |
|
EAN: 2147483647
Pages: 128