Administrative Tools
| The Administrative Tools are a collection of system control and configuration utilities which Microsoft deemed powerful and technical enough to separate into its own category from the Control Panel applets. The Administrative Tools include Component Services, Computer Management, ODBC Sources, Event Viewer, Local Security Policy, Performance, and Services. Each of these is discussed in the following sections (with the exception of Component Services and ODBC Sources which are not discussed in this book; please consult the Windows XP Resource Kit for details on these items). These two tools are fairly complex and are used by program developers and network database integrators. In most cases, these controls are beyond what most end users or administrators will need or use. Computer ManagementIn addition to the Task Manager and Control Panel, another tool named Computer Management (Figure 27.9) is probably the most likely candidate for configuring and administering your PC. To get to it, open the Control Panel (in Category view), select Performance and Maintenance, then Administrative Tools, and finally, double-click Computer Management. A simpler method is to right-click your My Computer icon (on your desktop or in your Start menu) and select Manage from the pop-up menu. Figure 27.9. The Computer Management utility from Administrative Tools. The Shared Folders node is selected.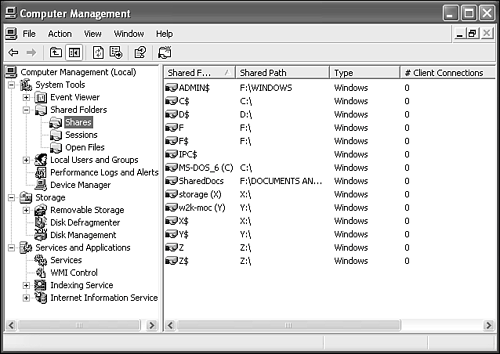 NOTE The Computer Management utility is just one of many MMC (Microsoft Management Center) tools. The MMC is a powerful programming infrastructure for creating system control utilities. You can even create your own custom tool sets using MMC consoles. The MMC is discussed in the "Microsoft Management Console (MMC)" section later in this chapter as well as in the Windows XP Resource Kit. Computer Management provides easy access to the following tasks:
The Computer Management tool looks similar to the familiar Windows Explorer. It uses a two-pane view, with the console tree (for navigation and tool selection) in the left pane and details of the active item shown the right pane. Items in the tree are called nodes (akin to folders in Explorer). The three nodes in Computer Management are as follows:
As you would expect, you can conduct administrative chores by selecting a tool in the console tree and then clicking items in the right pane. When you select an item in the right pane, toolbar and menu options change as appropriate for that item, typically displaying attributes of the item or tool you selected. For example, the System Information branch can show you which IRQs are assigned already, and the Local Users and Groups branch can display the names and properties of all the users on the machine. In previous versions of Windows NT, you had to hunt around through Control Panel applets to discover properties and settings that are now conveniently grouped together in Computer Management. I'll be honest; things are still a little confusing just because some of the properties available from Computer Management can also be reached via the Control Panel. An example is the Device Manager, which can be reached from the System applet in the Control Panel as well as the System Tools node in Computer Management. It's the same tool, and having multiple paths to the same destination is nothing new in Windows. TIP You must be assigned Administrator privileges to fully utilize the Computer Management tools. If you have lesser privileges, you'll have limited access to system properties and are locked out of making certain administrative changes to the system. Explore with the interface to uncover all that is available from these three "little" nodes in the left pane. However, avoid making any changes or modifications (where possible) unless you know what affects your alterations will have. You'll be surprised. Open each node by clicking the boxed + (plus) sign. If you choose View, Details, some helpful information about various items in the right pane is displayed along with the items. By default, you manage the local computer. To manage a remote computer (assuming you have permission), right-click the topmost item in the tree (Computer Management), and choose Connect to Another Computer. Also by default, the view is set to Basic. To gain access to more advanced settings in the console, choose View, Advanced. A few points about each node are listed in the following sections. System Tools NodeThis node includes five subnodes:
The Shared Folders node (refer to Figure 27.9) amounts to what used to be NetWatcher in previous Windows versions. The three folders under the Shared Folders node are as follows:
Storage NodeThis node includes three subnodes:
The Removable Storage is used to check the physical location of removable storage devices (such as CD-ROM, DVD-ROM, JAZ, Zip, tapes, and optical disks), check the existence of media pools (typically robot-controlled multidisk gadgets), and check properties of offline media. This node also provides a means for labeling, cataloging, and tracking all your removable media; controls library drives, slots, and doors; and provides drive-cleaning operations. This node can work together with data management or backup programs like the one supplied with Windows XP (the Backup program is covered in Chapter 29, "Managing the Hard Disk"), conveying information about storage properties. The Disk Defragmenter node runs the disk defragmenter program. This is the same tool with a slightly different interface as the Disk Defragmenter on the Tools tab of a drive's Properties dialog box. The Disk Management node runs Disk Management (known as Disk Administrator under Windows NT). This tool is used to define new drives as Basic or Dynamic, create/delete/manage partitions and volumes, format, assign drive letters, and so on. All three of these nodal tools are discussed in Chapter 29. Services and ApplicationsThrough the Services and Application node, you can view and manage the properties of any server service or application that is installed on the computer, such as the file indexing service, and IIS (Internet Information Server). If this were Windows Server 2003, you'd also have access to networking services such as DNS (domain name service) and DHCP (Domain Host Configuration Protocol). TIP Sometimes you might want to incorporate a list of displayed items into another document. You can export the list as a text file for this purpose. To do so, display the list in question, with the columns arranged as you like. Then choose Action, Export List. You can name the file in the resulting Save As dialog box. Event ViewerThe Event Viewer is an administrative application used to view the log files which record hardware, software, and system problems and security events. You can think of an event as any occurrence of significance to the operating system. Logs are very useful because, like a seismograph in earthquake country or a black box in an airplane, they provide a historical record of when events occurred. For example, you can see when services were started, stopped, paused, and resumed; or when hardware failed to start properly; when a user attempts to access protected files; or an attempt to remove a printer over which he or she doesn't have control. The logs report the level of danger to the system, as you can see in Figure 27.10. For a shortcut to the Event Viewer, you can choose Start, Control Panel (in Category view), Performance and Maintenance, Administrative Tools, Event Viewer. Figure 27.10. The System log viewed through the Event Viewer.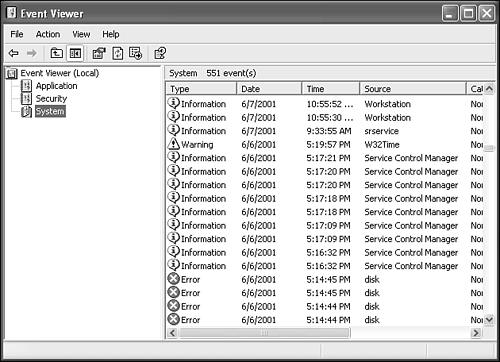 As you know, Windows XP has an intelligent internal security design. So, as you might expect, numerous more subtle events than those described here can generate messages internal to the operating system that are not directly reported to the user. Events such as applications being run, drivers being loaded, or files being copied between directories are common examples. Though kept out of sight, these events are monitored and recorded in log files available for later examination by the system administrator. Many events are stored in the log by default. Others are optional and can be set within dialog boxes pertaining to specific operations. Types of Log FilesWindows XP generates three primary logs (files), though others are possible. These logs are explained in Table 27.3.
Now that you have a basic understanding, let's consider the Event Viewer. The Event Viewer is an application that displays each of the log files. Aside from simply displaying a log file, the Event Viewer also lets you do the following:
NOTE Only a user with Administrative privileges can work with the security log. Other users can view the application and system logs, however. By default, security logging is turned off. You can use Group Policy to enable security logging. The administrator can also set auditing policies in the Registry that cause the system to halt when the security log is full. Working with Event Viewer LogsThe following steps explain how you can use the Event Viewer to open the three available logs and more easily view specific events:
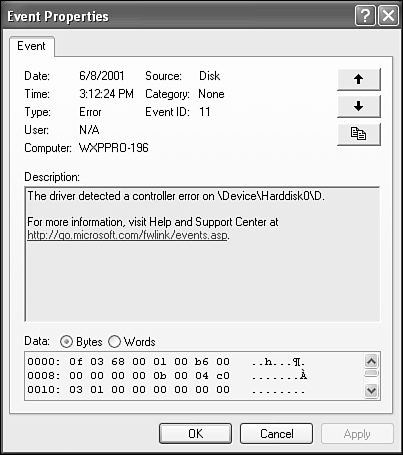
Details of your security log won't make much sense if you're not a programmer. Even then, the messages are cryptic. The system and application logs offer more in the way of understandable English. Most useful is information about drivers failing to load (often leading you to IRQ and port conflict resolutions). Viewing a Remote Computer's LogsBy default, the local computer's log is displayed. If you want to examine a networked computer's log, just right-click over the Event Viewer (local) node and select Connect to another computer from the pop-up menu. Log InterpretationCareful monitoring of event logs can help you predict and identify the sources of system problems. For example, if log warnings show that a disk driver can read or write to a sector only after several retries, this information could be a foreshadowing that the hard disk sector may die eventually. Logs can also confirm problems with software. If a program crashes, a program event log can provide a record of activity leading up to the event. When a program does crash, you often see a system message informing you that a log entry is being made. Essentially, each log file consists of a database table with eight columns, which are described in Table 27.4.
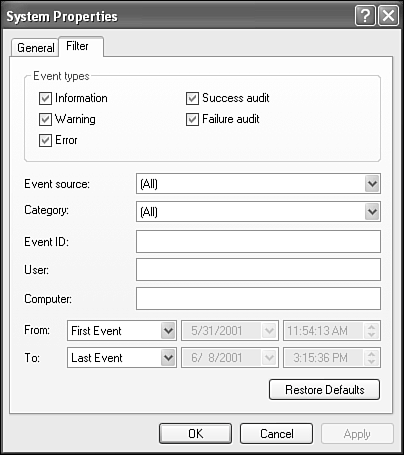
As mentioned in Table 27.4, five different icons characterize an event type, as shown in Table 27.5. TIP Many typical hardware problemssuch as conflicting protocols, network card conflicts, and IRQ conflictsare reported in the system log. The Event Viewer can help you sleuth out possible entries explaining the problem. Filtering EventsOne way of seeing several similar events you're interested in (for example, to see how many times the same event occurred) is to click the relevant column head in the Event Viewer. Clicking the head sorts the listing according to the column's data. As in Windows Explorer and other Windows programs, the column sorter toggles between ascending and descending order. A more powerful approach for culling out the items you're interested in is to use filtering. When logs get quite large or if you have a server that supports a high density of workstation activity, this approach might be the most effective technique for ferreting out what you need to examine. The System Properties dialog box you use for filtering is shown in Figure 27.12. Figure 27.12. On the Filter tab of the System Properties dialog box, you can limit the listing to specific conditions.
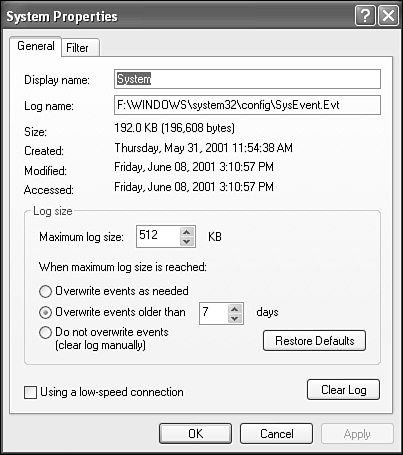
After you set up a filter, don't be alarmed if all your entries suddenly seem to have disappeared; they're probably just being filtered. Check the View menu, and you'll see the Filter option selected. Choose it again to eliminate the filter. Setting Logging OptionsYou can stipulate a few settings that affect how log entries are recorded. These settings are most useful in managing the size of your logs so that they don't eat up too much disk space. There are potentially so many loggable events that even a typical day on a busy network server could produce far larger log files than you would want to wade through, or that you would want to devote disk space to. To view or change options for a log file, right-click the log file in question, and choose Properties. Then click the General tab to see the dialog box shown in Figure 27.13. Figure 27.13. Setting a log's options.
If you don't archive the log (see the next section), then you should probably have the log "wrap" around after it reaches the maximum log size. The Overwrite Events as Needed option ensures that, when the log fills up, a new event takes the place of the oldest preexisting log entry. If you really want to ensure that you get to see the log entries, choose the Do Not Overwrite Events option. After the maximum size is reached, subsequent events are not written, and thus lost. If so, you have to use the Action, Clear All Events command to make room for new entries. Using Archived Log FilesA final option in the Event Viewer lets you create archives of log files and to reload those files for later examination. As a rule, archiving log files isn't of much use unless you're running a very secure operation in which extensive background records of system or network usage are mandated by the government or the corporation where you work. Most likely, in such a secure operation, you'll be doing regular tape or other forms of backup, which might include backups of the log files anyway. In this case, this regimen might meet your security requirements, depending on your tape rotation scheme. If it doesn't, you can archive your event logs. Archiving is a relatively simple process. You can store archives as text files, comma-delimited files (text files with a comma between each field for use in database or spreadsheet programs that can import this format), or binary files with the .EVT extension. Only the .EVT files retain all the property information for each event. If you want to reload the file for later use, save it as an .EVT file. TIP One case to be made for archiving is this: Logs can be useful in isolating network or machine failures. By keeping copies of past logs, you have something to compare with current versions that list new failures. By comparing logs, you can perhaps notice how and when the errors began to accumulate. Generally speaking, a network failure starts simple and then increases in frequency until a catastrophic failure occurs. Old logs can help here. Note that the file created by the archiving process isn't affected by any filtering active at the time. That is, all events in the log are written into the archive file. The Action, Save Log File As command can save the log as a .EVT, .TXT, or .CSV file. The Action, Export List command can save into .TXT or .CSV as plain text or Unicode text. NOTE After you save, the log is archived, but the current log isn't cleared. Its contents are unaffected. If your log is full, you have to clear it manually. To recall an archived log for later examination, open it using the Open Log File command from the Action menu.
ServicesAs you learned in Chapters 1 and 2, Windows XP is highly modular. Many of the inner housekeeping chores of the operating system are broken down into services that can be added, removed, started, and stopped at any time, without requiring a reboot. A typical Windows XP system has 80 or more services running at any one time. You can view which services are running by using the Services tool. Use this tool to start and stop services. Figure 27.14 shows a typical Services listing. To start, stop, pause, or restart a service, you can use the context menu or the VCR-like buttons on the toolbar. For deeper control of a service, such as to declare what automatic recovery steps should be taken in the case of the service crashing, which hardware profiles it should run in, and more, open its Properties dialog box. Figure 27.14. While you're checking the status of services, you can start, stop, and pause system services from this screen.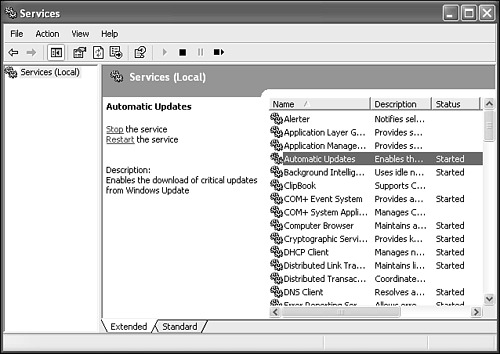 Within the Properties dialog box, you'll find controls to set a service's startup type (automatic, manual, or disabled), start/stop/pause/resume buttons, and a startup parameters field. You also can set the account under which the service is executed (Log On tab), define how a service recovers from failures (for example, restart, run a program, or reboot the system) (Recovery tab), and view a list of service, program, and driver dependencies (Dependencies tab). |
EAN: 2147483647
Pages: 450
